


To infinity and beyond! Can price charts cope?
I recently read a review of a musical theatre piece based on a book by Michael R. Jackson called ‘A Strange Loop’. Following on from a previous Barbican production starring Joana Seguro and Royal Society Fellow Marcus du Sautoy, the Society describes it as ‘jumping between the logical loops of Kurt Gödel, the impossible geometry of MC Escher and the interlocking cadences of Johann Sebastian Bach, the two discuss the self-referential and repeating patterns in nature and art, and perhaps the strangest loop of all – our own consciousness’.
I attach a picture of Escher’s endless House of Stairs print. The link to Bach is his Canon 5, where the music rises through the whole chromatic scale to end where it began. Think of the musical notation written on a horizontal strip of paper. Cut it once, give the paper a half twist, and stick the ends together: you have an endless loop.
It made me wonder whether price charts and technical analysis more generally could cope with this concept. Coming from a commodities background, I had always assumed that there was no upper boundary to price, and that the lower one was zero; basing patterns would take this into account. I and many others had a shock awakening when, in early 2020, the front month New York crude oil future collapsed – albeit briefly – to  minus about $47 per barrel.
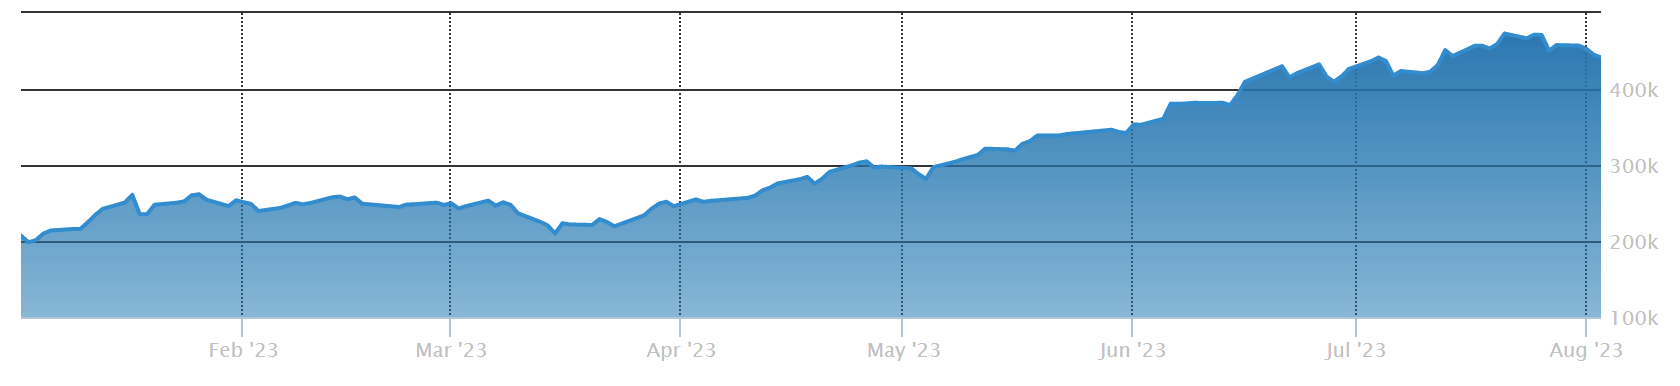
S&P Merval underneath courtesy of WSJ Markets
Similarly the lower limit to interest rates is no longer nought, and recency bias has made many mortgage holders believe that money ought to cost next-to-nothing. The European Central Bank key rate was at a nominal negative from 2016 to 2022 – then it suddenly soared to 3.75% on deposits and 4.25% for refinancing. Real interest rates – nominal rates adjusted for inflation – have often been negative, as they are currently in the UK, with CPI inflation running at 8% per annum and Bank of England Bank Rate at 5.25.
Inflation is often the culprit for extreme currency volatility and devaluation. As Riad Salameh stepped down this week as Lebanon’s central bank governor of the last 30 years, Monocle reports that the lira has lost 90% of its buying power versus the US dollar, and more shockingly that 80% of those in the country are living in poverty. Here the zero bound holds.
In Argentina today you need 277 pesos (at the official exchange rate) to buy 1 US dollar. The blue/black exchange rate is 560; just like credit spreads, the difference between the two varies over time. Up until the 2002 devaluation the Argentine peso was pegged at parity to the greenback. Today there is no upper limit to USDARS’s parabolically ‘bullish’ price chart. Likewise the Buenos Aires Merval stock index which this time last year stood at 118,345 and then at July’s peak measured 471,223. With inflation running (officially) at 100% per annum, is this really bullish?
For a visualisation as to how things can spiral out of control, take a look at this short video
Tags: Infinity, repetition, variations on a theme, zero bound
The views and opinions expressed on the STA’s blog do not necessarily represent those of the Society of Technical Analysts (the “STA”), or of any officer, director or member of the STA. The STA makes no representations as to the accuracy, completeness, or reliability of any information on the blog or found by following any link on blog, and none of the STA, STA Administrative Services or any current or past executive board members are liable for any errors, omissions, or delays in this information or any losses, injuries, or damages arising from its display or use. None of the information on the STA’s blog constitutes investment advice.


Latest Comments