


Elastic bands, bonds and rebounds: How to spot reversals – in charts and thinking
As a kid, did you fear an elastic band? Today in Britain you are likely to see these scattered along residential streets, discarded by Royal Mail postmen (little kids sometimes collect them in a ball). In the school playground however, the bully would sometimes threaten to pull the rubber taught and then ping it back sharply onto the back of your hand. Anticipation was usually worse than the punishment.
What’s this got to do with markets, you ask? Well, over the last twelve to eighteen months we’ve seen quite a few financial markets surge suddenly, disrupting all the best laid plans. Now we are wondering what next.
The starting gun were European energy futures – well before Russia’s attack on Ukraine. Many UK energy companies went to the wall by funding gas supplies in the spot market while writing long term contracts for retail customers; simple maturity mismatch. Moaning that moves were ‘unprecedented’ and that we were in ‘uncharted territory’, had they bothered to look at our first chart of long term US Natural Gas futures prices, they would have seen that this product was one of the world’s most volatile – and had been for decades. Basically: riddled with sudden and unexpected surges which on the whole subsided just as quickly. Candlestick and bar charts label these as ‘tweezers’, ‘shooting stars’, ‘bearish engulfing’ patterns and sometimes ‘island reversals’.
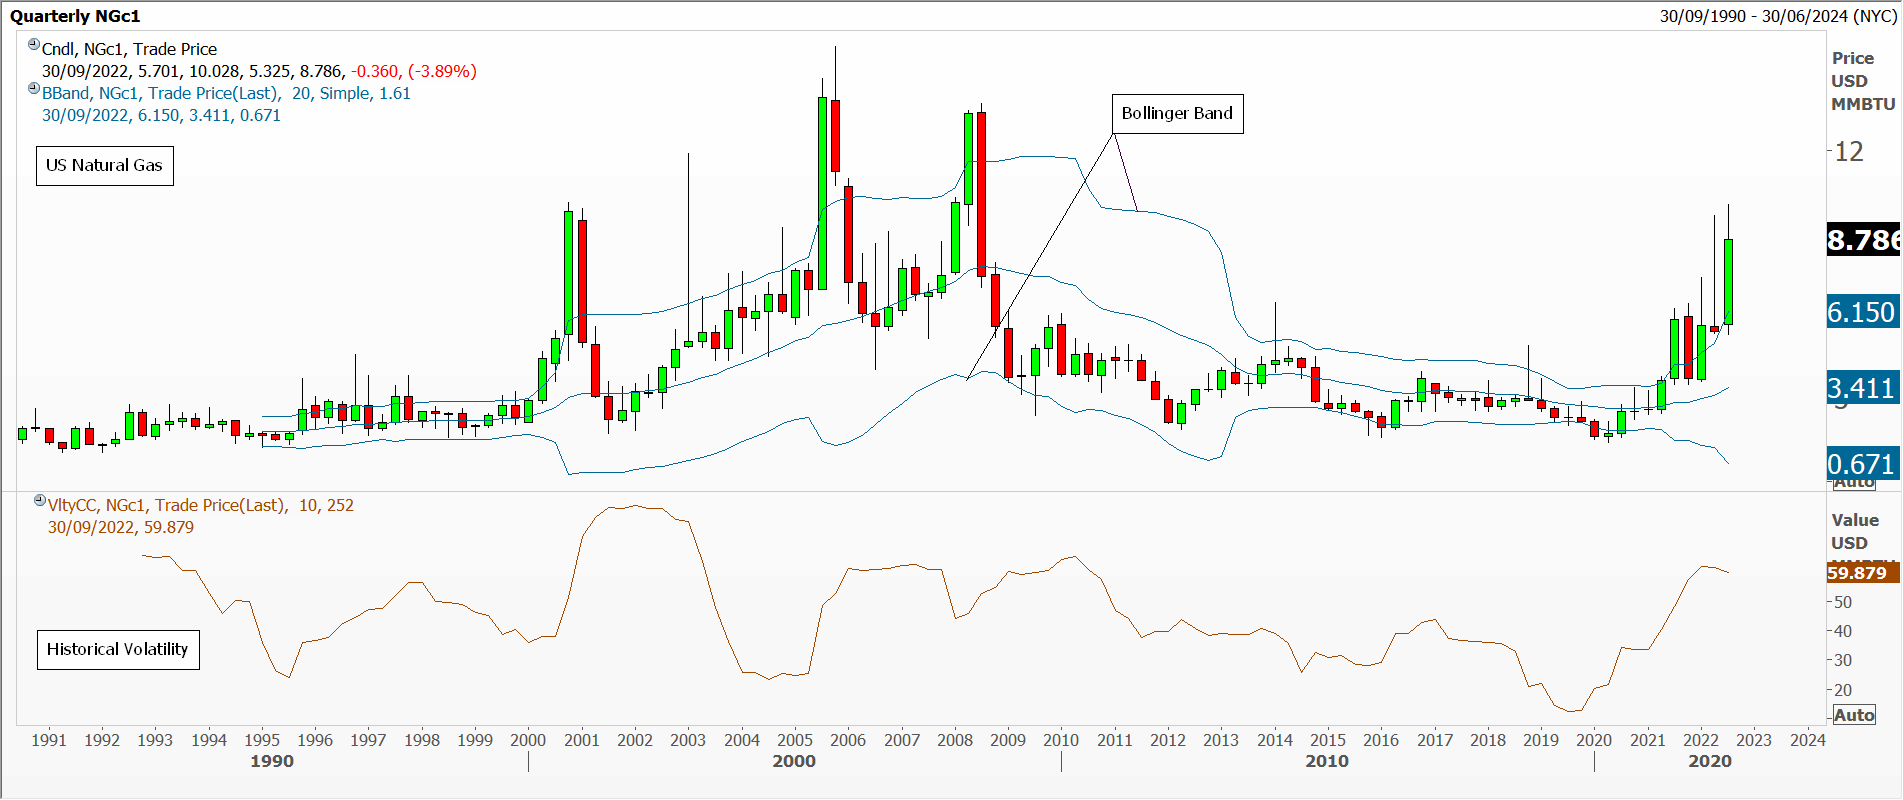
Natural Gas Chart courtesy of Refinitiv
When the writers at the Financial Times took an interest in US Lumber futures when they soared suddenly in 2020 – sleepy hollow to all but those immediately involved – you were warned. Last in first out sort of syndrome. See my second chart.
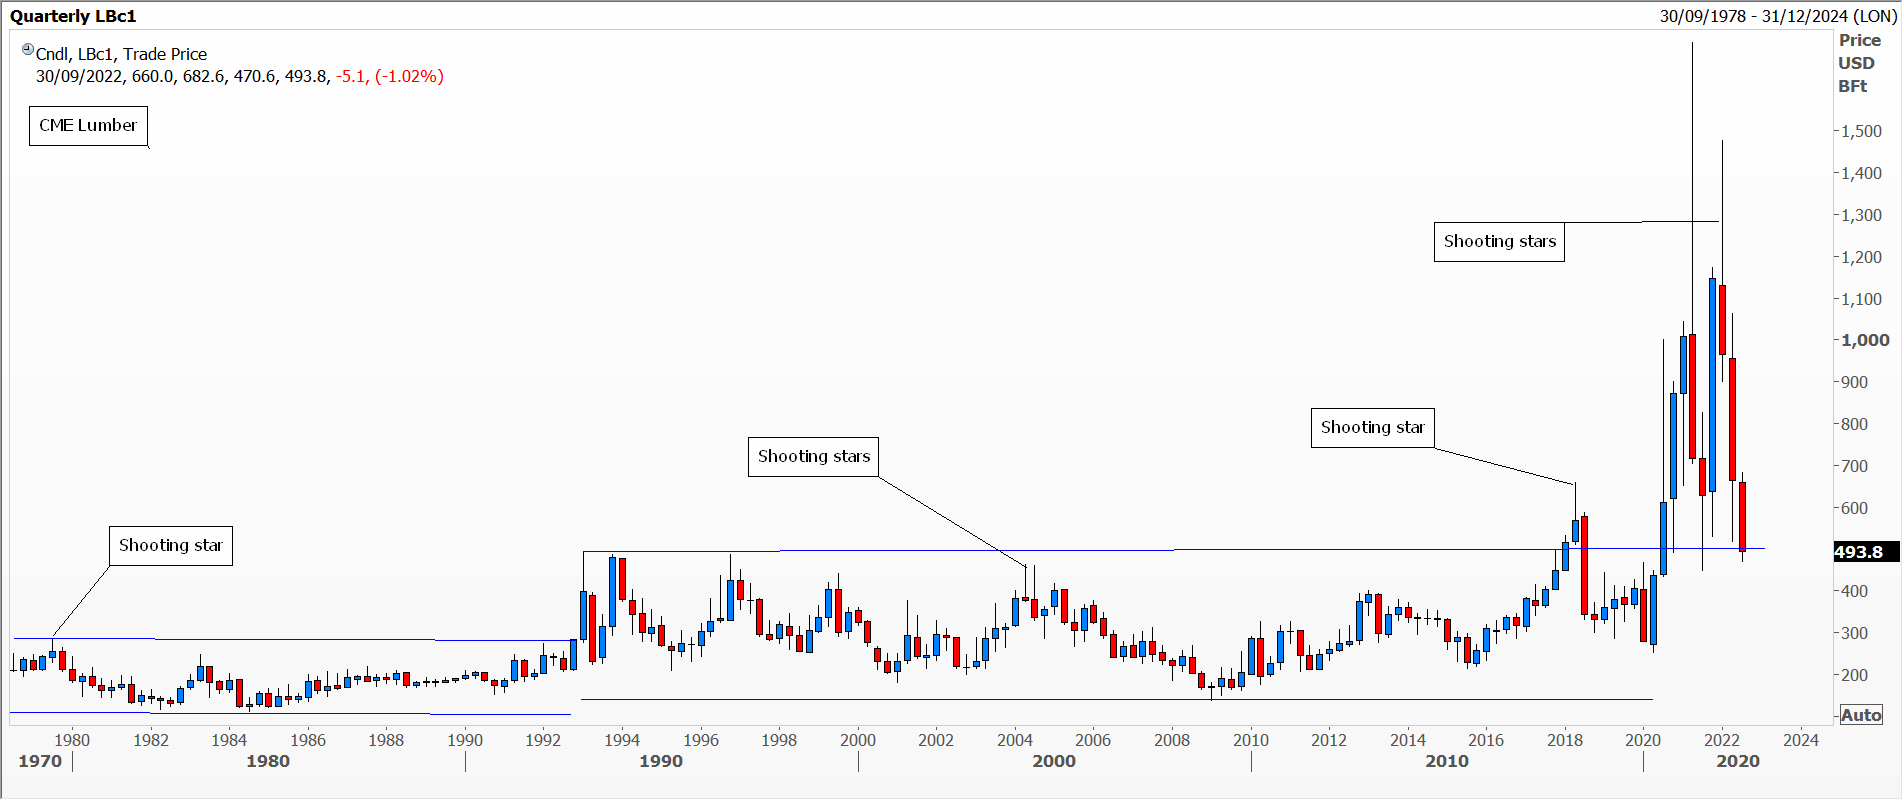
Lumber Chart courtesy of Refinitiv
Central bankers are currently hoping for something similar to happen with inflation. Having missed the boat on the way up, complacently believing they knew what was best for their nations, once again they are as we say: ‘behind the curve’: Watch for collateral damage.
But stretching to an extreme does not necessarily hint at a dramatic reversal, especially where inflation is involved. In my last blog I discussed the Argentine Merval stock index. At Sunday’s elections a rank outsider, rock and media star Javier Milei, was in pole position for the preliminaries to October’s general election in Argentina. His radical ideas about privatising state companies, using the greenback as local currency and abolishing the central bank, forced the latter on Monday to devalue the peso to an official 350 to the US dollar, hiking the key interest rate to 118% while the parallel ‘blue/black’ rate found a new record high exchange rate at 600. Just imagine trying to run a business under these conditions.
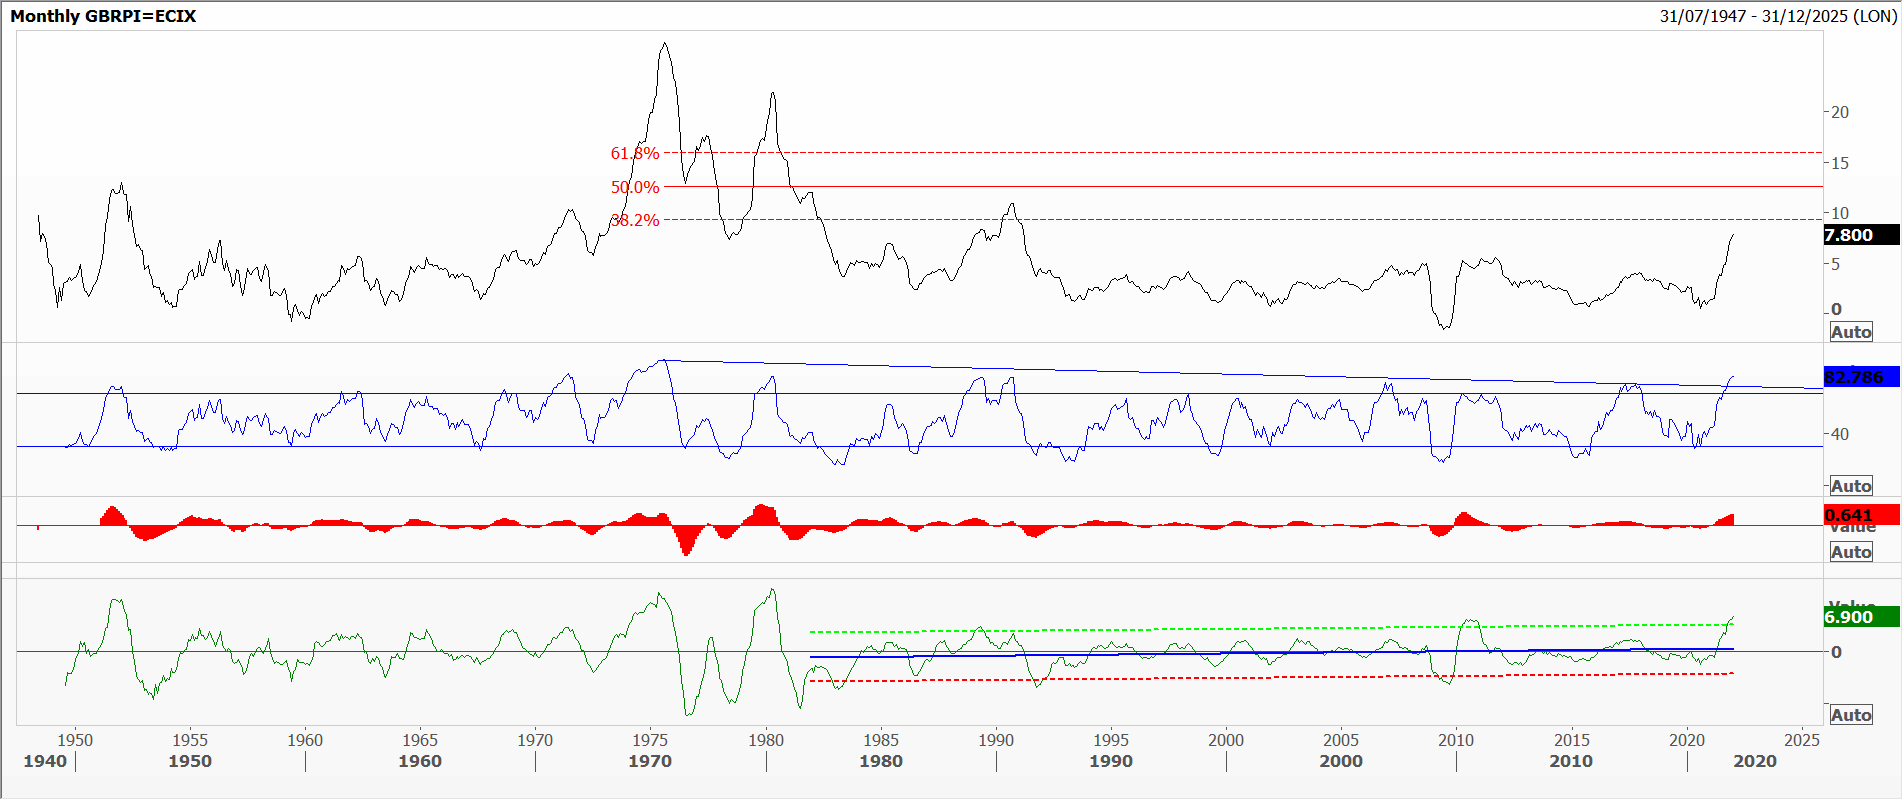
UKRPI Chart courtesy of Refinitiv
The views and opinions expressed on the STA’s blog do not necessarily represent those of the Society of Technical Analysts (the “STA”), or of any officer, director or member of the STA. The STA makes no representations as to the accuracy, completeness, or reliability of any information on the blog or found by following any link on blog, and none of the STA, STA Administrative Services or any current or past executive board members are liable for any errors, omissions, or delays in this information or any losses, injuries, or damages arising from its display or use. None of the information on the STA’s blog constitutes investment advice.


Latest Comments