


Study volume at price: To enhance your options
Paul McLaren, founder of technical analysis firm Enhance Your Options Pty Ltd ©2017, addressed STA members Tuesday with some very interesting charts and ideas. Explaining how people, including us techies, can be divided into two camps – visuals and quants (who prefer something that can be mathematically measured). Running in parallel is the tendency to differentiate between probability, which is a subjective measure, and frequency which is objective. Then overlay this with the trend for an individuals’ bias to change over time – and one ends up with a complex set of trading rules.

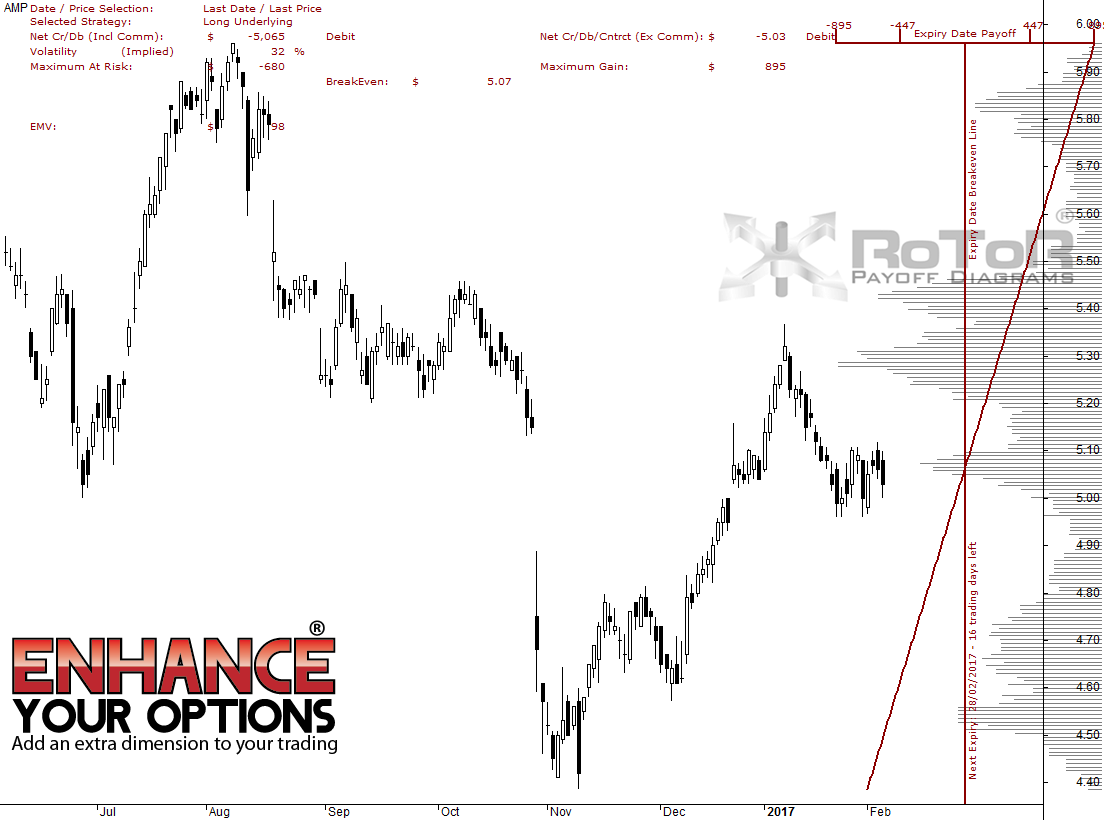
Kicking off with a fabulous chart showing conventional candlesticks with a horizontal histogram on the right hand side, he plots total volume traded at each level on the vertical axis. Thus we end up with time marching across the bottom, price along the left, and volume up the right of the chart. This obviously means that markets where volume is not available or transparent will not really benefit from his methodology. As time moves on, the histogram will change shape as new trades and possibly new prices are added to the running total.
He then focuses on searching for support and resistance levels, with a strong emphasis on gaps. High Volume Nodes indicate a consolidation phase where both buyers and sellers perceive fair value. Low Volume Nodes are usually the result of a break out, of which a gap is the ultimate example.
Favouring the buying of option straddles, he needs a fast break through a chart level to compensate for time decay. He then goes on to hedge open option positions with yet more options, depending on how the market pans out and how the volume at price chart changes.
The STA’s librarian snapped up one of his books, as did several in the audience, as it was felt Paul’s method would be of interest to many. It’s ‘The Wiley Trading Guide’ featuring writing from a variety of traders, John Wiley & Sons Australia 2010. You can also get an overview of what he does via this link.
Tags: Auction Martet Theory, histogram, Market Profile, probability, volume
The views and opinions expressed on the STA’s blog do not necessarily represent those of the Society of Technical Analysts (the “STA”), or of any officer, director or member of the STA. The STA makes no representations as to the accuracy, completeness, or reliability of any information on the blog or found by following any link on blog, and none of the STA, STA Administrative Services or any current or past executive board members are liable for any errors, omissions, or delays in this information or any losses, injuries, or damages arising from its display or use. None of the information on the STA’s blog constitutes investment advice.


Latest Comments