


Speed Resistance Lines: A new one on me, and a variation on a theme
One of the problems of having my email address plastered all over the place, is that I get a lot of unsolicited mail. There is an upside though, as sometimes I get very nice letters from people I don’t know. This happened yesterday, when someone who will be sitting the STA Diploma Part 2 paper in October, having studied via our Home Study Course, contacted me. His question: Speed Resistance Lines, developed by Edson Gould, was not covered in the HSC course – but he obviously rates the method – so would it be included in the exam?
Well, obviously, I have absolutely no idea what the exam questions are, so I replied that a question on this specific subject was unlikely, but he should certainly use it as part of an answer to one of them. That’s not the end of the story though, because what he likes, is something I know nothing about. He’d told me it was covered in John Murphy’s ‘bible’ of technical analysis, so I knew where to turn.
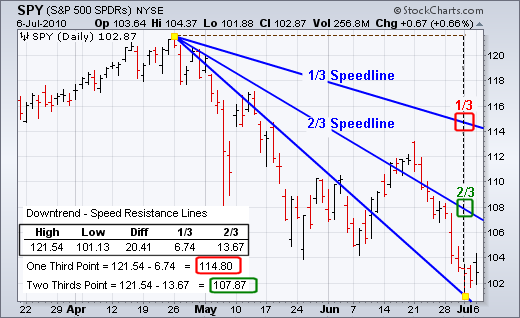
It’s an interesting variation on drawing trend lines, linked to a version of Fibonacci retracements, with a touch Gann lines thrown in. You start with a trend you’ve spotted, draw a vertical from the low or latest high,  then divide this vertical into 3 equal segments. Mark these points on the vertical and then connect, first one, then the other point, to the starting point of the trend; you’ll have 2 diagonals starting at the same point but at different angles.
On new highs or lows, re-draw the vertical and the 2 speedlines. Corrections can retreat to either the steeper or the shallower speedline. If the latter is broken, the trend has ended and prices are likely to revert to their starting point and the lines reverse their roles, acting as resistance when they had been support and vice versa – classic Dow Theory. Obviously, you’ll end up with different lines as intermediate trends develop, like a brilliant chart in my 1986 Murphy.
Today I’ve copied the chart from stockcharts.com, which I can recommend, because my Reuters Eikon does not have this analysis. Pity, as I think it’s intuitively clear and rather neat.
The views and opinions expressed on the STA’s blog do not necessarily represent those of the Society of Technical Analysts (the “STA”), or of any officer, director or member of the STA. The STA makes no representations as to the accuracy, completeness, or reliability of any information on the blog or found by following any link on blog, and none of the STA, STA Administrative Services or any current or past executive board members are liable for any errors, omissions, or delays in this information or any losses, injuries, or damages arising from its display or use. None of the information on the STA’s blog constitutes investment advice.


Latest Comments