Secondary technical indicators: Their moment in the limelight
Being a ‘fear and greed’ sort of technical analyst, I’ve been having a great time with stock market indices this month; big moves, punchy candlesticks, speechless equity analysts backpedalling. Such fun! One thing that did make me sit up and pay attention was a note on the Zero Hedge website (seriously controversial but studded with little gems a lot of the time) www.zerohedge.com.
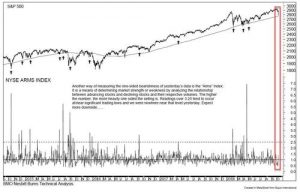
Last week I honed in on a write-up based on a note by Russ Visch, Vice President, Technical Analyst at BMO Bank of Montreal. He has his work cut out as he covers commodity, currency, fixed income and equity markets – the latter unsurprisingly the focus of the paper. Looking at the NYSE Arms Index for the S&P 500, he concluded that selling pressure on Wednesday the 10th October 2018 wasn’t all that strong; it wasn’t a panic.
 My worry was that I hadn’t used that technical tool in years, and couldn’t remember what it was. I printed out the piece (so much for my paperless office) with note to self to delve deeper. My ancient John Murphy book had nothing to say on the subject, so over to www.stockcharts.com (which I like) and from where I’m happily copying and pasting.
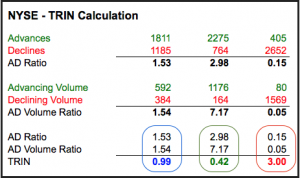
Also known as the TRIN or Short-Term TRading INdex, the Arms Index is a breadth indicator developed by Richard W. Arms in 1967. The index is calculated by dividing the Advance-Decline Ratio by the Advance-Decline Volume Ratio. Typically, these breadth statistics are derived from NYSE or Nasdaq data, but the Arms Index can be calculated using breadth statistics from other indices such as the S&P 500 or Nasdaq 100. Because it acts as an oscillator, the indicator is often used to identify short-term overbought and oversold situations. So, we’re looking at volume-adjusted rising versus falling share prices.
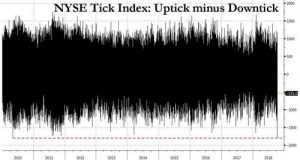
Thursday the 11th was different though. Then, Jonathan Krinsky of Bay Crest Partners, noted that just after 14:40 US Eastern Time the NYSE Tick Index of upticks minus downticks saw so many sell orders that not only did the Dow Jones Industrial Average lose 600 points in a matter of minutes, but the Tick ratio hit -1793, the most bearish reading since the ‘flash crash’ of 6th May 2010.
 What John J. Murphy does have to say more broadly about measures of contrary opinion is that as futures contracts are a zero sum game, if 80 per cent of market participants are long and 20 per cent short, the shorts hold bigger positions; they are therefore better capitalised and are the stronger hand. Keep that in mind.
Tags: Arms index, NYSE Tick, oscillators, volume
The views and opinions expressed on the STA’s blog do not necessarily represent those of the Society of Technical Analysts (the “STA”), or of any officer, director or member of the STA. The STA makes no representations as to the accuracy, completeness, or reliability of any information on the blog or found by following any link on blog, and none of the STA, STA Administrative Services or any current or past executive board members are liable for any errors, omissions, or delays in this information or any losses, injuries, or damages arising from its display or use. None of the information on the STA’s blog constitutes investment advice.
Latest Posts
- How I Used Dow Theory to Strengthen My Market Convictions June 20, 2025
- The New Monetary Order: Russell Napier on Inflation, Debt, and Financial Repression June 12, 2025
- Why I Became (and remain) a Member of the STA May 29, 2025
- The Emotional Rollercoaster of Markets: Why Bubbles Repeat and How to Outsmart Them: Summary of Kim Cramer Larsson talk May 14, 2025
- Avoid Overusing Indicators: Streamline Your Trading Strategy May 7, 2025


Latest Comments