


Price, price relative, and spreads: Variations on a price chart
As pointed out a fortnight ago in the STA blog, I believe that Charles Dow’s third tenet, that the market discounts all news, is the most important of his six. Put it another way, price contains all current knowledge, expectations and forces of supply and demand. So far so good. Housewives and people on a budget will know exactly the price of a pint of milk, a kilo of potatoes, and a litre of petrol. With this information they can then search for anomalies and bargains.
This line of thinking gets a little more difficult with products that are either not available locally, rarely traded, or new to the market. For example: foie gras, very large diamonds, and the latest must-have fashion item. For these we tend to revert to comparing the price to something similar and related and from this calculating the spread of one over the other, or the percentage premium over the generic.
We can also work with ratios. Shall I buy a six-pack of underwear from Primark, or just one from Victoria’s Secret, say. A kilo of fillet steak or several of beef shin?
As you can see both the spread and the ratio take one a step away from pure price, and major financial markets use these all the time. Even someone with zero knowledge of technical analysis will understand the underlying concept behind the difference between a BBB-rated bond and a AAA one. Or the yield curve, where in normal circumstances interest rates rise the longer the loan maturity.
One of the oldest of ratios is that between gold and silver. How many ounces of silver do I need to buy one of gold? (Note: this ratio was very different prior to the discovery of the Americas and of South Africa’s gold mines). As you can see in the chart attached, it has been spectacularly volatile since January 2020.
A variation on this theme is how many barrels of crude oil does one need to buy an ounce of gold. Again, as with the above I have plotted the very long term mean regression with 2 standard deviations around it. This too has had a torrid time since January 2020. Putting two and two together, it suggests that the price of gold has been more volatile than usual.
My third chart is a more recent tool in the analyst’s box of tricks. It is the value of the S&P 500 index divided by the VIX index of expected volatility. This one is far more tricky, as the VIX (the denominator) can easily double or halve in the blink of an eye, yet the index (the numerator) is far less likely to do so, especially the bigger the value of the index becomes.
Now, step back and ask yourself, am I really looking at a number that contains all knowledge? Sometimes I’m not sure, and therefore believe that traditional technical analysis might not work for all charts. I suggest one proceed with caution.

Gold-Silver
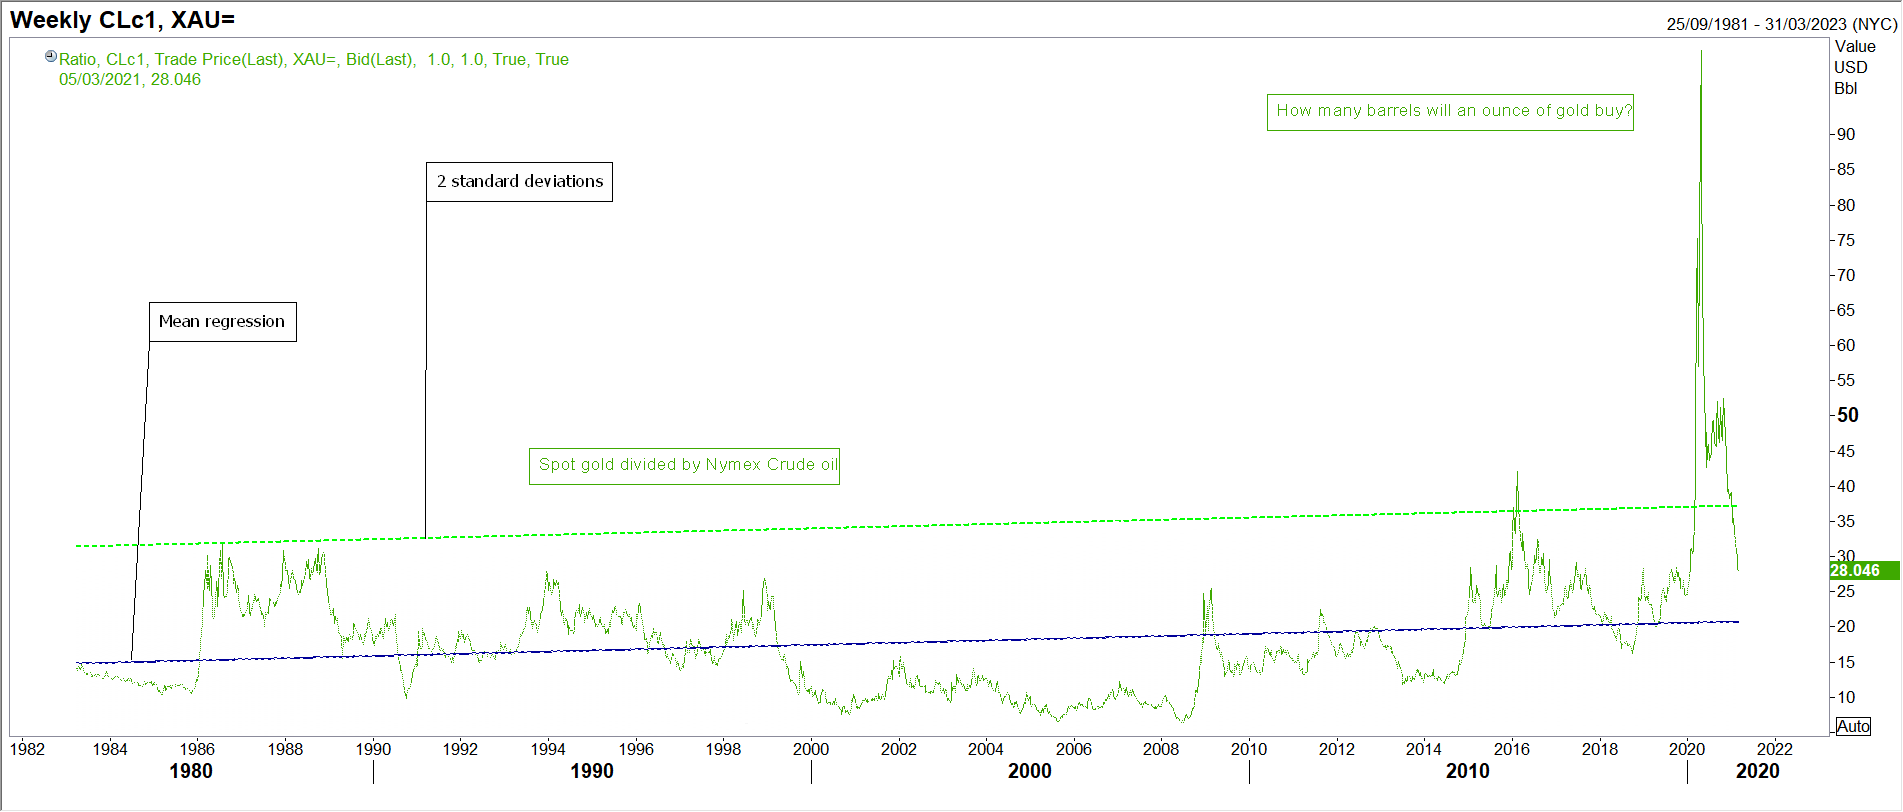
Gold-Crude
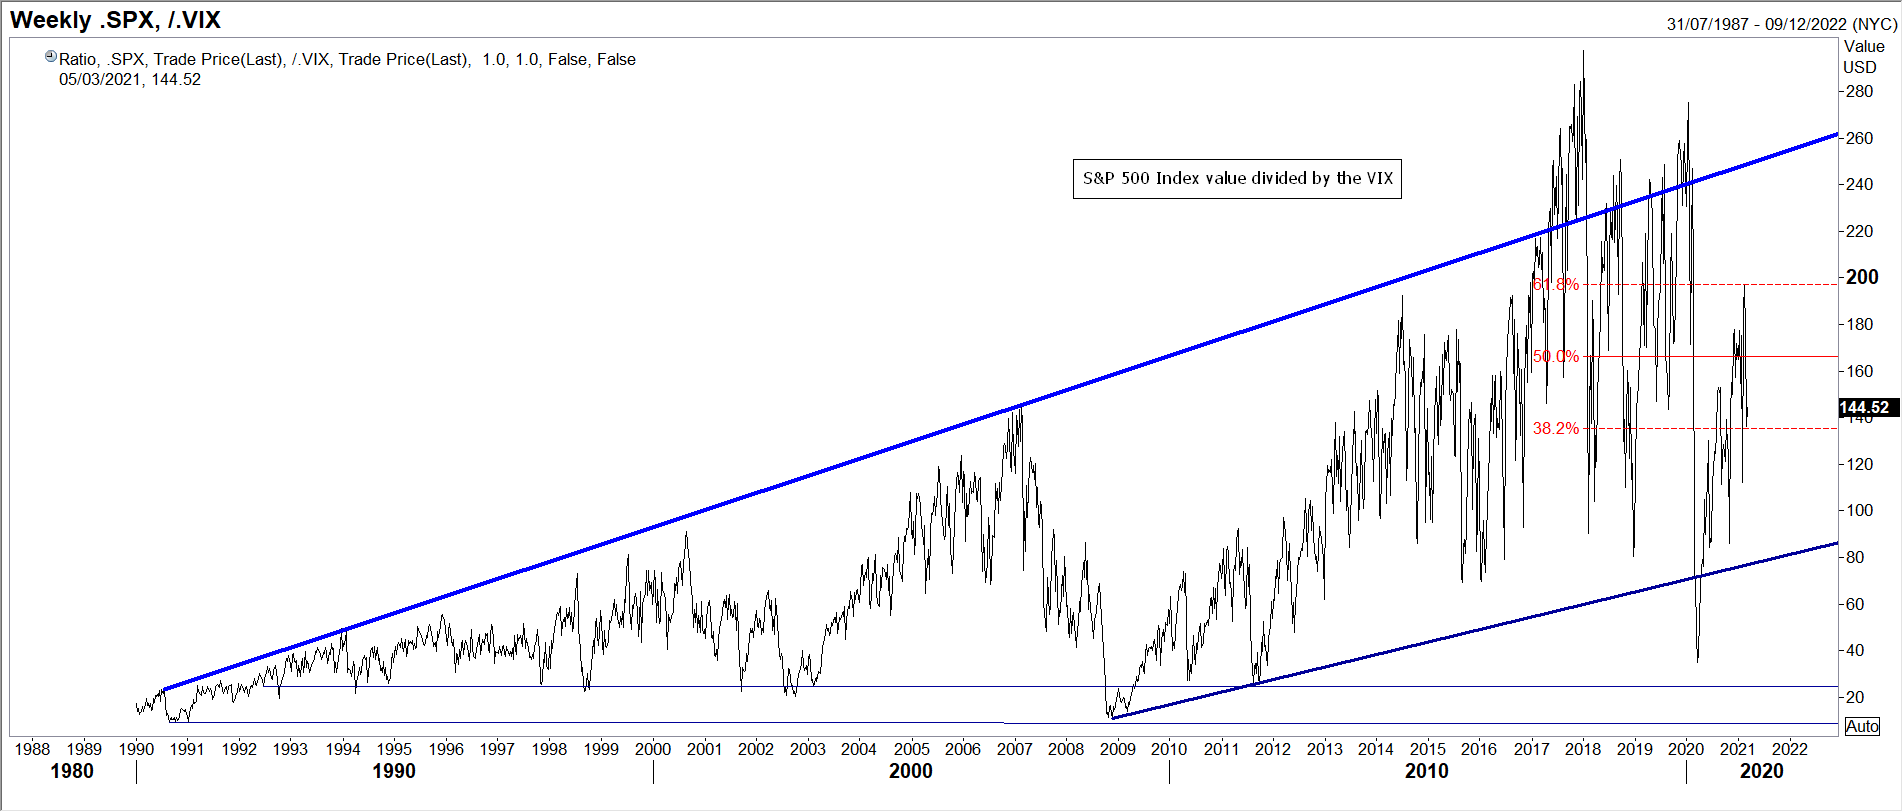
S&P Vix
Tags: ratio, regression, relative, Spreads
The views and opinions expressed on the STA’s blog do not necessarily represent those of the Society of Technical Analysts (the “STA”), or of any officer, director or member of the STA. The STA makes no representations as to the accuracy, completeness, or reliability of any information on the blog or found by following any link on blog, and none of the STA, STA Administrative Services or any current or past executive board members are liable for any errors, omissions, or delays in this information or any losses, injuries, or damages arising from its display or use. None of the information on the STA’s blog constitutes investment advice.


Latest Comments