


Polling and reality: What do they know?
Walking back from my local polling station today, determined to say my piece in the most unusual and unpredictable British election in living memory, I started thinking about opinion polls. Dictionary definitions of ‘poll’ include:
The process of voting in an election.
Dialect: a person’s head. [Yes really a surprise to me]
Record the opinion or vote of.
Telecoms and computing: check the status of (a device), especially as part of a repeated cycle [Umm]
What many do not realise, though Mori and others have made a business out of this, is that polling data is a discreet information set that too many disregard, technical analysts included. Needless to say, not so politicians.
Into my inbox today popped this interesting chart courtesy of Ross Finley and his polling team at Reuters. This was of expectations for the US March Trade Deficit. What’s this got to do with technical analysis? Lots, because it’s all to do with expectations, psychology, framework, surprises, and crowded trades.
The chart shows that over the last five years the US monthly trade deficit has fluctuated between $37.5 and $50.5 billion dollars (yellow line). Data for March was $51.4 billion, the lowest since 2008 and a record low if one excludes crude oil and energy international trade.
The blue line is the median forecast of the many analysts polled; not the mean as outliers unduly influence results. The gap between expectation and fact in March 2015 was the widest over the period, and lower than the most pessimistic forecaster (the red line).
This tells you an awful lot about how markets are priced before the data, what sort of number will make them jump, and how far the subsequent move might go.
We should add this to our armoury of sentiment indicators, just like volume, implied volatility, and open interest.
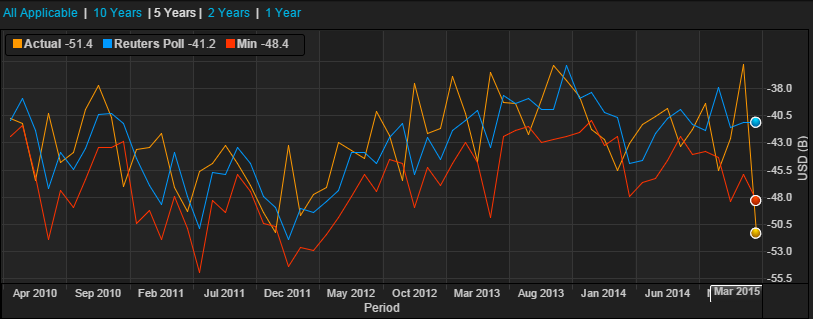 Chart courtesy of Reuters.
The views and opinions expressed on the STA’s blog do not necessarily represent those of the Society of Technical Analysts (the “STA”), or of any officer, director or member of the STA. The STA makes no representations as to the accuracy, completeness, or reliability of any information on the blog or found by following any link on blog, and none of the STA, STA Administrative Services or any current or past executive board members are liable for any errors, omissions, or delays in this information or any losses, injuries, or damages arising from its display or use. None of the information on the STA’s blog constitutes investment advice.


Latest Comments