Market reaction to US July Consumer Price Inflation:
Released Wednesday 11th August 12:30 GMT
With inflation being the financial markets’ biggest worry since February, and acres of print being given over to discussions as to whether central banks are correct in labelling it ‘transitory’, no wonder this data series has recently taken on an added clout. Therefore, many day-traders will be poised to try and make a quick buck out of it. No point rushing in at the last minute though, as every professional trader, and chef for that matter knows, it’s ‘all in the prep’.
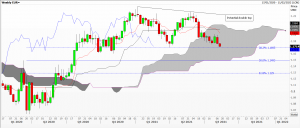
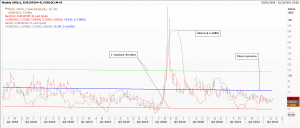
Stand back and take a look as to where we’ve come from [Chart EUR1], a weekly candle chart showing that the euro is currently at its weakest against the US dollar so far this year. It’s hovering on a 38% Fibonacci support level which is also a potential neckline to a double top. Is it any wonder that some nerves are jangling? Nevertheless, looking at the second chart [Chart EUR2] we can see that historical volatility remains as subdued as it has been for most of the last three and a half years. Both at-the-money puts (red bars) and call (black bars) options are trading below the mean regression.
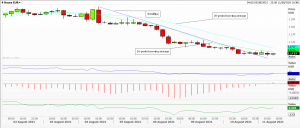
The next chart [Chart EUR3]
plots 4-hourly candles (times along the bottom are BST), starting at the beginning of the month, where a gentle but steady downtrend for the euro can be seen, nudged lower by the 10 and 20-period moving averages. Since late Tuesday it’s been more of a sideways move (in a ridiculously tiny range), so that the RSI is less oversold and the MACD histogram has seen its first bullish value in ages – even though momentum is resolutely bearish.
Technical analysis prep done, lets consider US CPI data itself. Both retail prices and core inflation (which excludes volatile food and energy prices), having trundled along around 2% since 2008, suddenly soared in May – after February’s sudden spurt higher in Treasury yields (the bond market is often the first to anticipate trends). A good part of the current problem are year-on-year comparisons which have been thrown totally out of kilter by 2020’s lockdown – which caused the biggest economic contraction in anything up to 300 years. Re-bounds from ultra-low levels might sound impressive – like Heathrow’s July 2021 passenger numbers up 75% from this time last year, while remaining 80% below the level of July 2019. Actual CPI figures released were +0.5% CPI and +0.3% Core M/M, annualised at +5.4% and 4.3% respectively, very close to a tight consensus forecast from leading economists.
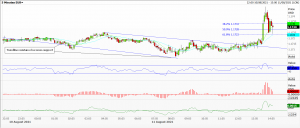
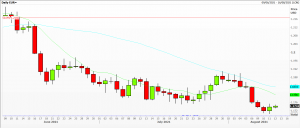
So what happened next? The slightly bullish hint in our third chart did follow through [chart EUR4]
on the break of $1.1715. One hour after the data release we’d rallied to a high at $1.1748 to give back 38% of the burst at $1.1723. As of Thursday morning the chart is even more depressing [Chart EUR5], with the tiniest bullish engulfing pair – blink and you’ll miss it – on the daily candlestick chart.
Now, tell me: are investors really worried about inflation in the USA and whether the Federal Reserve will ‘taper’ its extraordinary monetary largesse in force since the great financial crash of 2008?
Tags: 5 minute charts, Economic data, oscillators, volatility
The views and opinions expressed on the STA’s blog do not necessarily represent those of the Society of Technical Analysts (the “STA”), or of any officer, director or member of the STA. The STA makes no representations as to the accuracy, completeness, or reliability of any information on the blog or found by following any link on blog, and none of the STA, STA Administrative Services or any current or past executive board members are liable for any errors, omissions, or delays in this information or any losses, injuries, or damages arising from its display or use. None of the information on the STA’s blog constitutes investment advice.
Latest Posts
- Living in a land of large numbers: How to get a grip July 24, 2024
- Debate with ACI UK, The Broker Club & The Commodities Trading Club: Forecasts for the second half – plus marks for first half July 10, 2024
- Retail traders embrace volatility: Zero-day options and penny stocks on today’s menu June 24, 2024
- STA members and their guests get a dose of hypnotherapy June 12, 2024
- ‘And it’s a goal! Again’ Rectangles, corsets and straightjackets May 28, 2024




Latest Comments