


Market reaction to UK September Consumer Price Inflation
Released Wednesday 20th October 2021 at 07:00 BST
For months, nay years, inflation has not been a talking point of the chattering classes; now suddenly it is. From retail prices growing negligibly – or even negatively – for the best part of a decade, and usually undershooting the new central bank target of two per cent, pressures in the global trade network are causing shortages and higher prices.
UK CPI in August stood at an annualised 3.2%, the highest since April 2012 though below the peak at 5.2% since 2007. Polls suggested that half of respondents expected another small increase in September, the other half a tiny dip, which was exactly what we got today at 5.1% due to a monthly increase of just 0.3% as compared to the previous month’s 0.7%. Interestingly the old RPI, on which pay-outs for index-linked government bonds are based, rose from 4.8% to 4.9% Y/Y, where I’m assuming it’s due to home/rent costs.
Last month the Bank of England predicted that UK inflation might rise to just over 4.0% in the next three 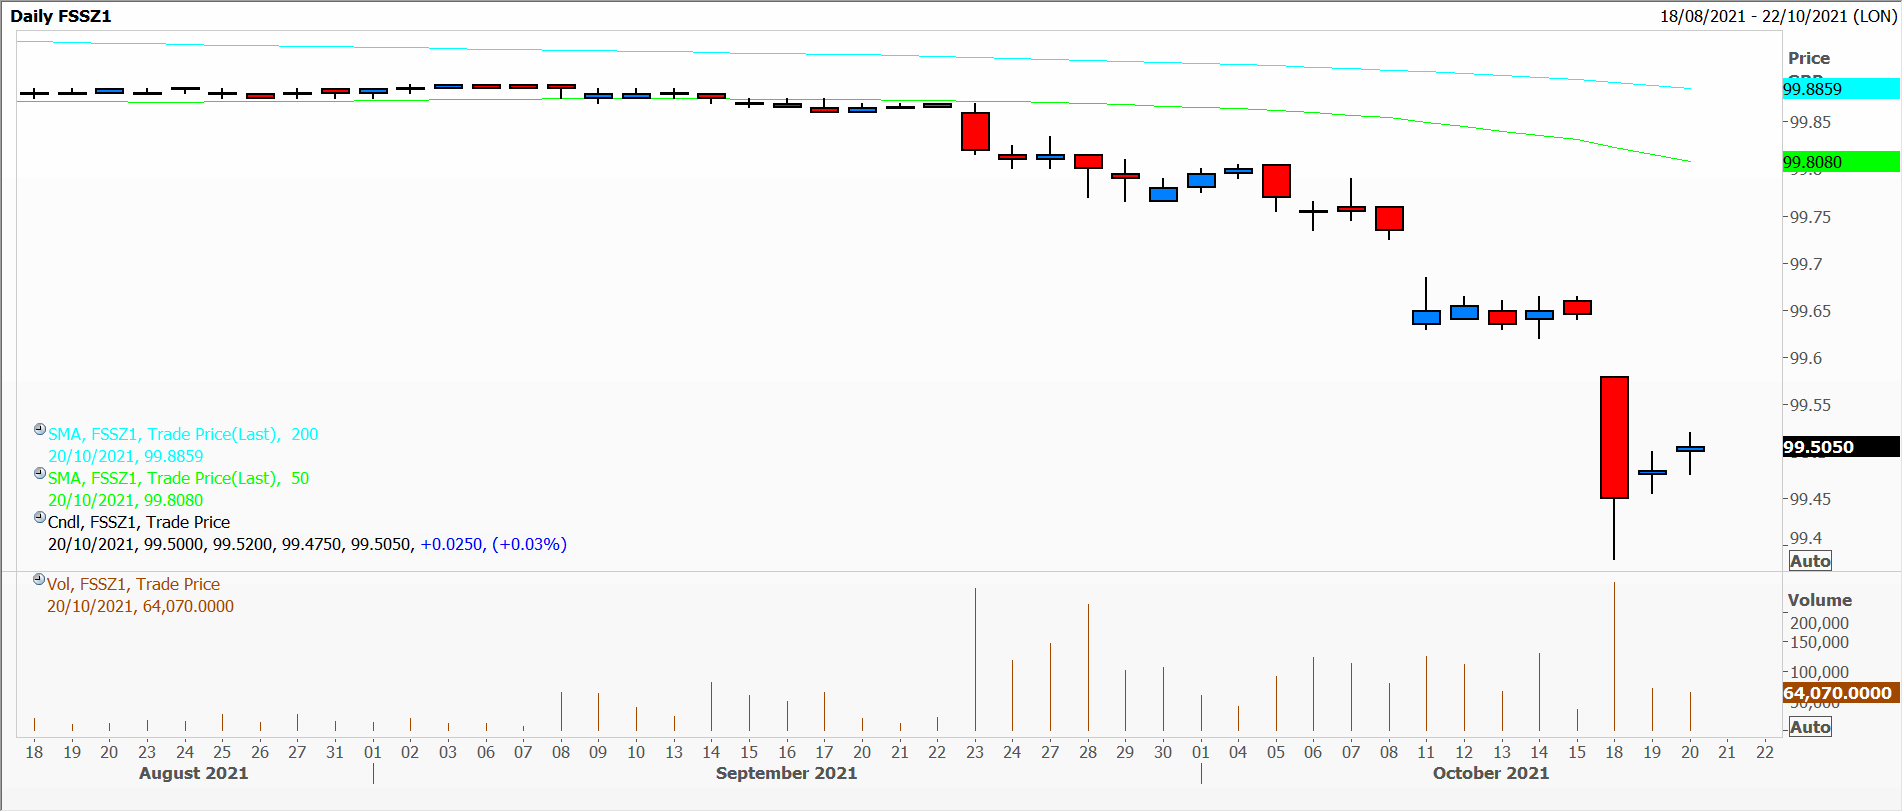 months. In a TV interview on Bloomberg aired on Sunday the 17th October Andrew Bailey said that the Bank will ‘’have to act’’ on inflation. Needless to say Short Sterling interest rate futures have fallen sharply over the last six weeks, yet clambered off their lows early this week. Gilts were not impacted as much, causing a flattening of the yield curve.
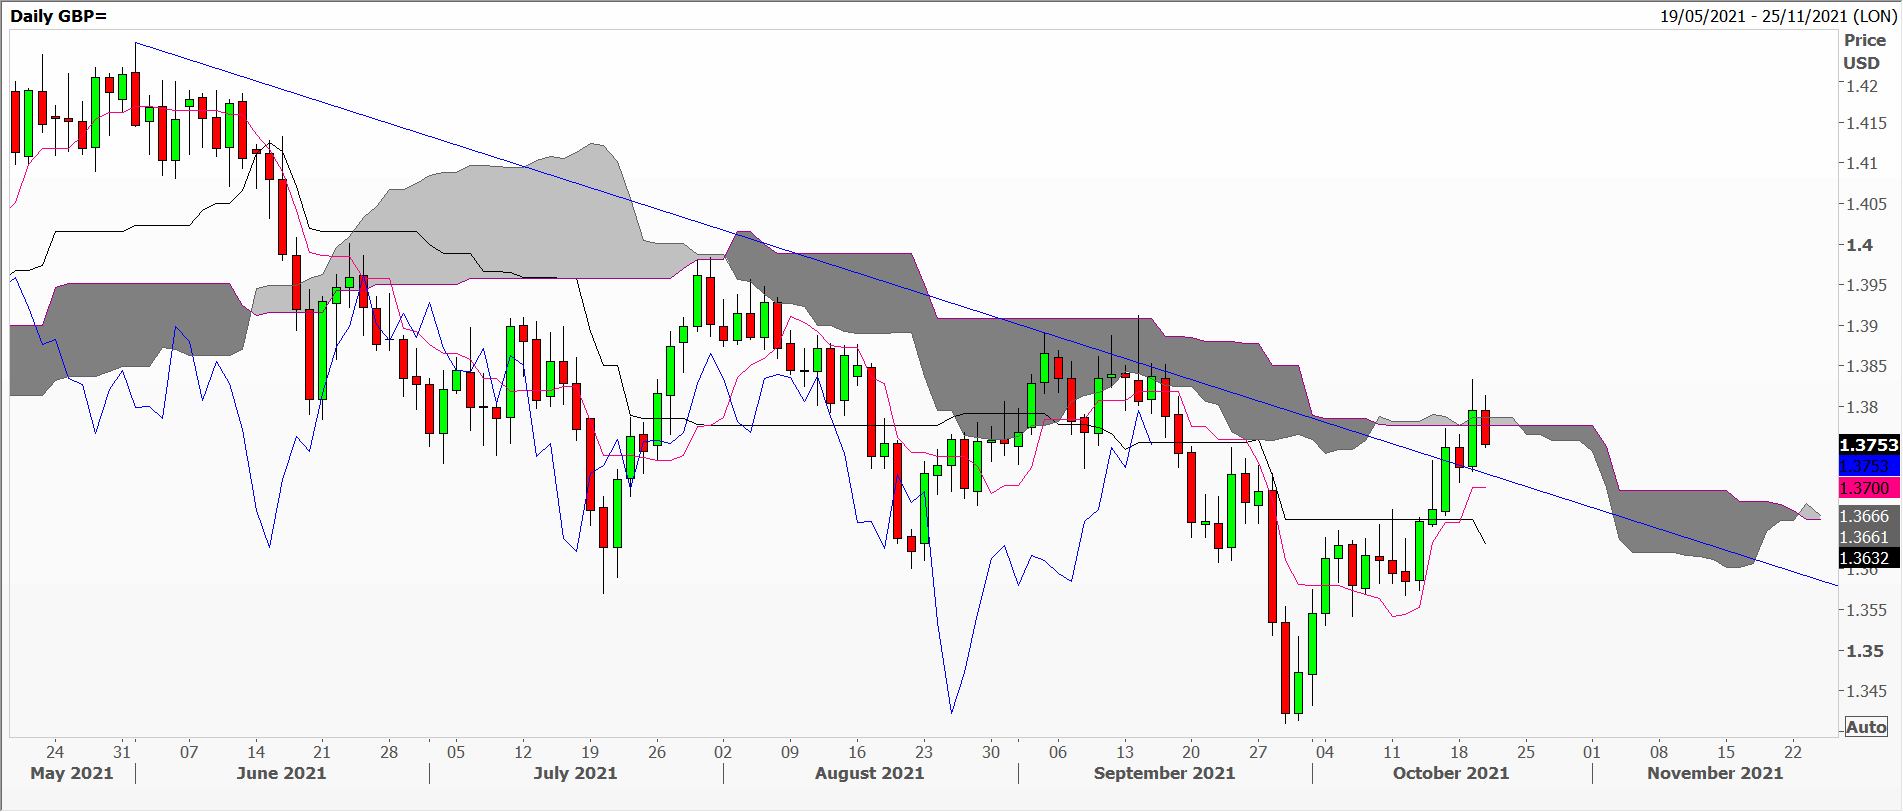 Looking at the daily chart of Cable – the exchange rate of US dollars per British pound – you can see that it rallied off a recent low around $1.3400 on the expectation of a possible Bank Rate hike. Note that at 6.3%, historical volatility is close to its lowest levels in 15 years, and that yesterday the chart stalled at a very thin Ichimoku cloud.
Since very early this morning the 5-minute chart shows it has retreated from an interim high just above 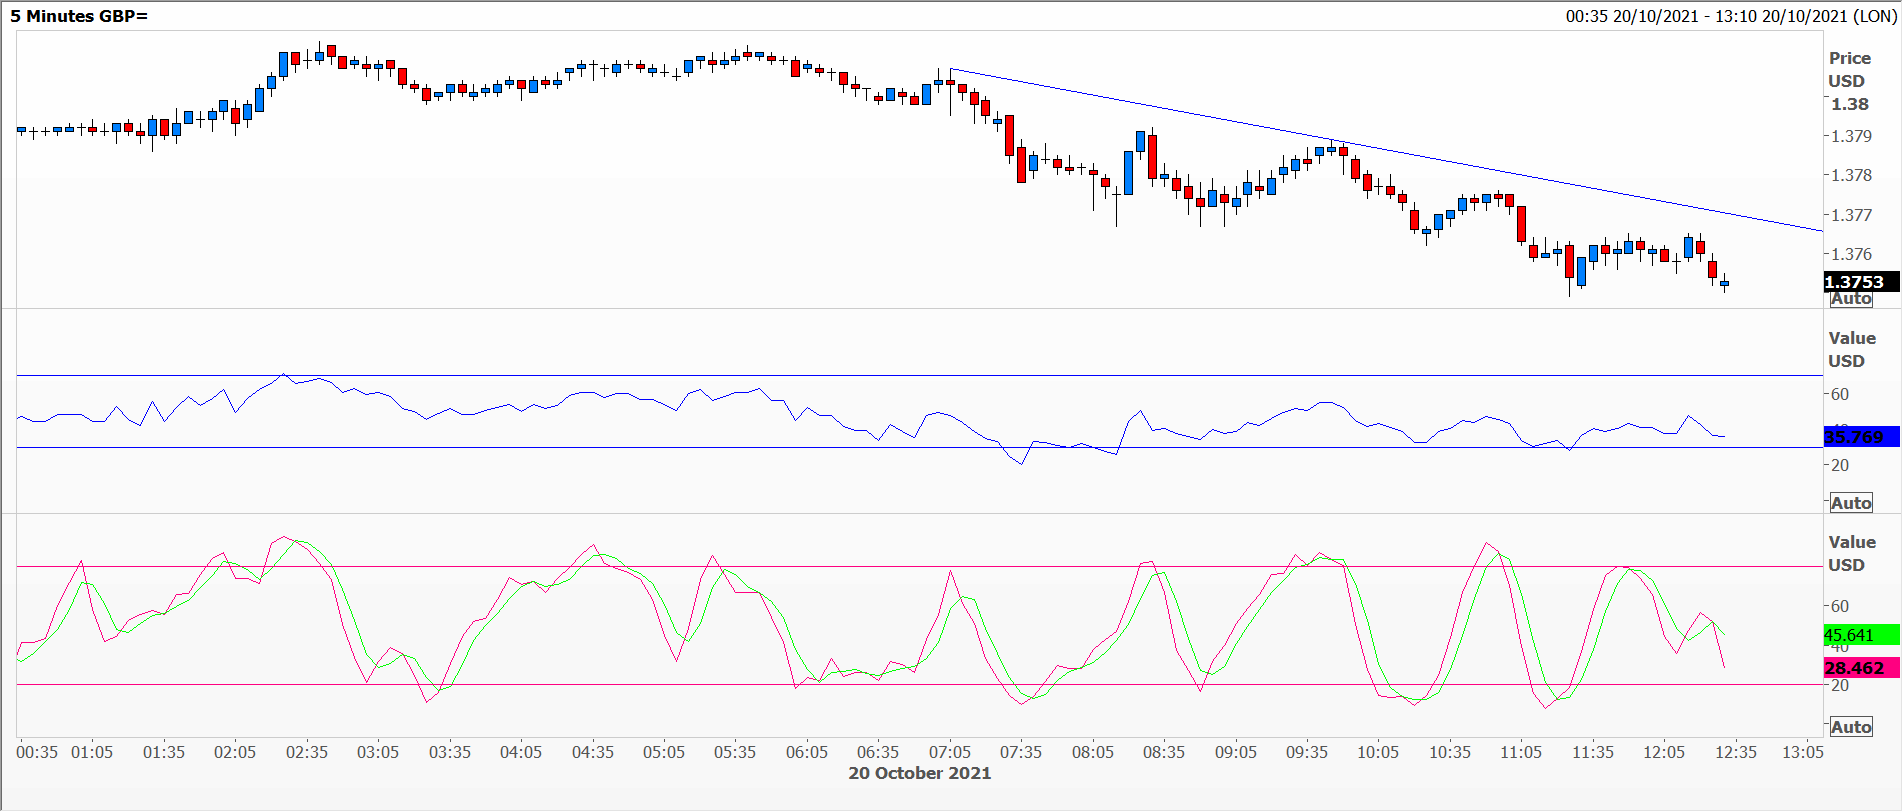 $1.3800, the slide picked up the pace as European traders joined in and CPI data was released. Along the way the RSI was warning that the market might be over-sold, and now the slow stochastic is getting close to the level (20) at which one might begin to consider basing activity with a potential double bottom at $1.3740. A close above the descending trend line at $1.3770 would be a start, and a close clearly above the top of the daily cloud another slightly bullish signal.
Tags: 5 minute charts, Economic data, inflation, RSI, volatility
The views and opinions expressed on the STA’s blog do not necessarily represent those of the Society of Technical Analysts (the “STA”), or of any officer, director or member of the STA. The STA makes no representations as to the accuracy, completeness, or reliability of any information on the blog or found by following any link on blog, and none of the STA, STA Administrative Services or any current or past executive board members are liable for any errors, omissions, or delays in this information or any losses, injuries, or damages arising from its display or use. None of the information on the STA’s blog constitutes investment advice.


Latest Comments