


‘Long Term Forecasting using Interdisciplinary Price Analysis (IPA)’: A presentation by Tom Bundgaard of Kairos Commodities
My heart sort of sank when it was announced that his system involved technical analysis, fundamental analysis and macroeconomics; not only that, these were then integrated in three dimensions. Things looked up when Jeff Boccaccio MSTA introduced him, and Tom got the side comment about being unable to have a pale ale together after the talk. Though based in Copenhagen, his spoken English is excellent and so too were his slides and the presentation as a whole.
Very much in awe of Edward Dewey, his long term (5 year) forecasts are based on cycle analysis – ‘everything that has been studied has been found to have cycles present’ – according to Dewey. For a three year horizon Tom dips into Elliott Wave, for two years conventional technical analysis, and for one year classic macro and fundamentals – with intermarket analysis for shorter time horizons.
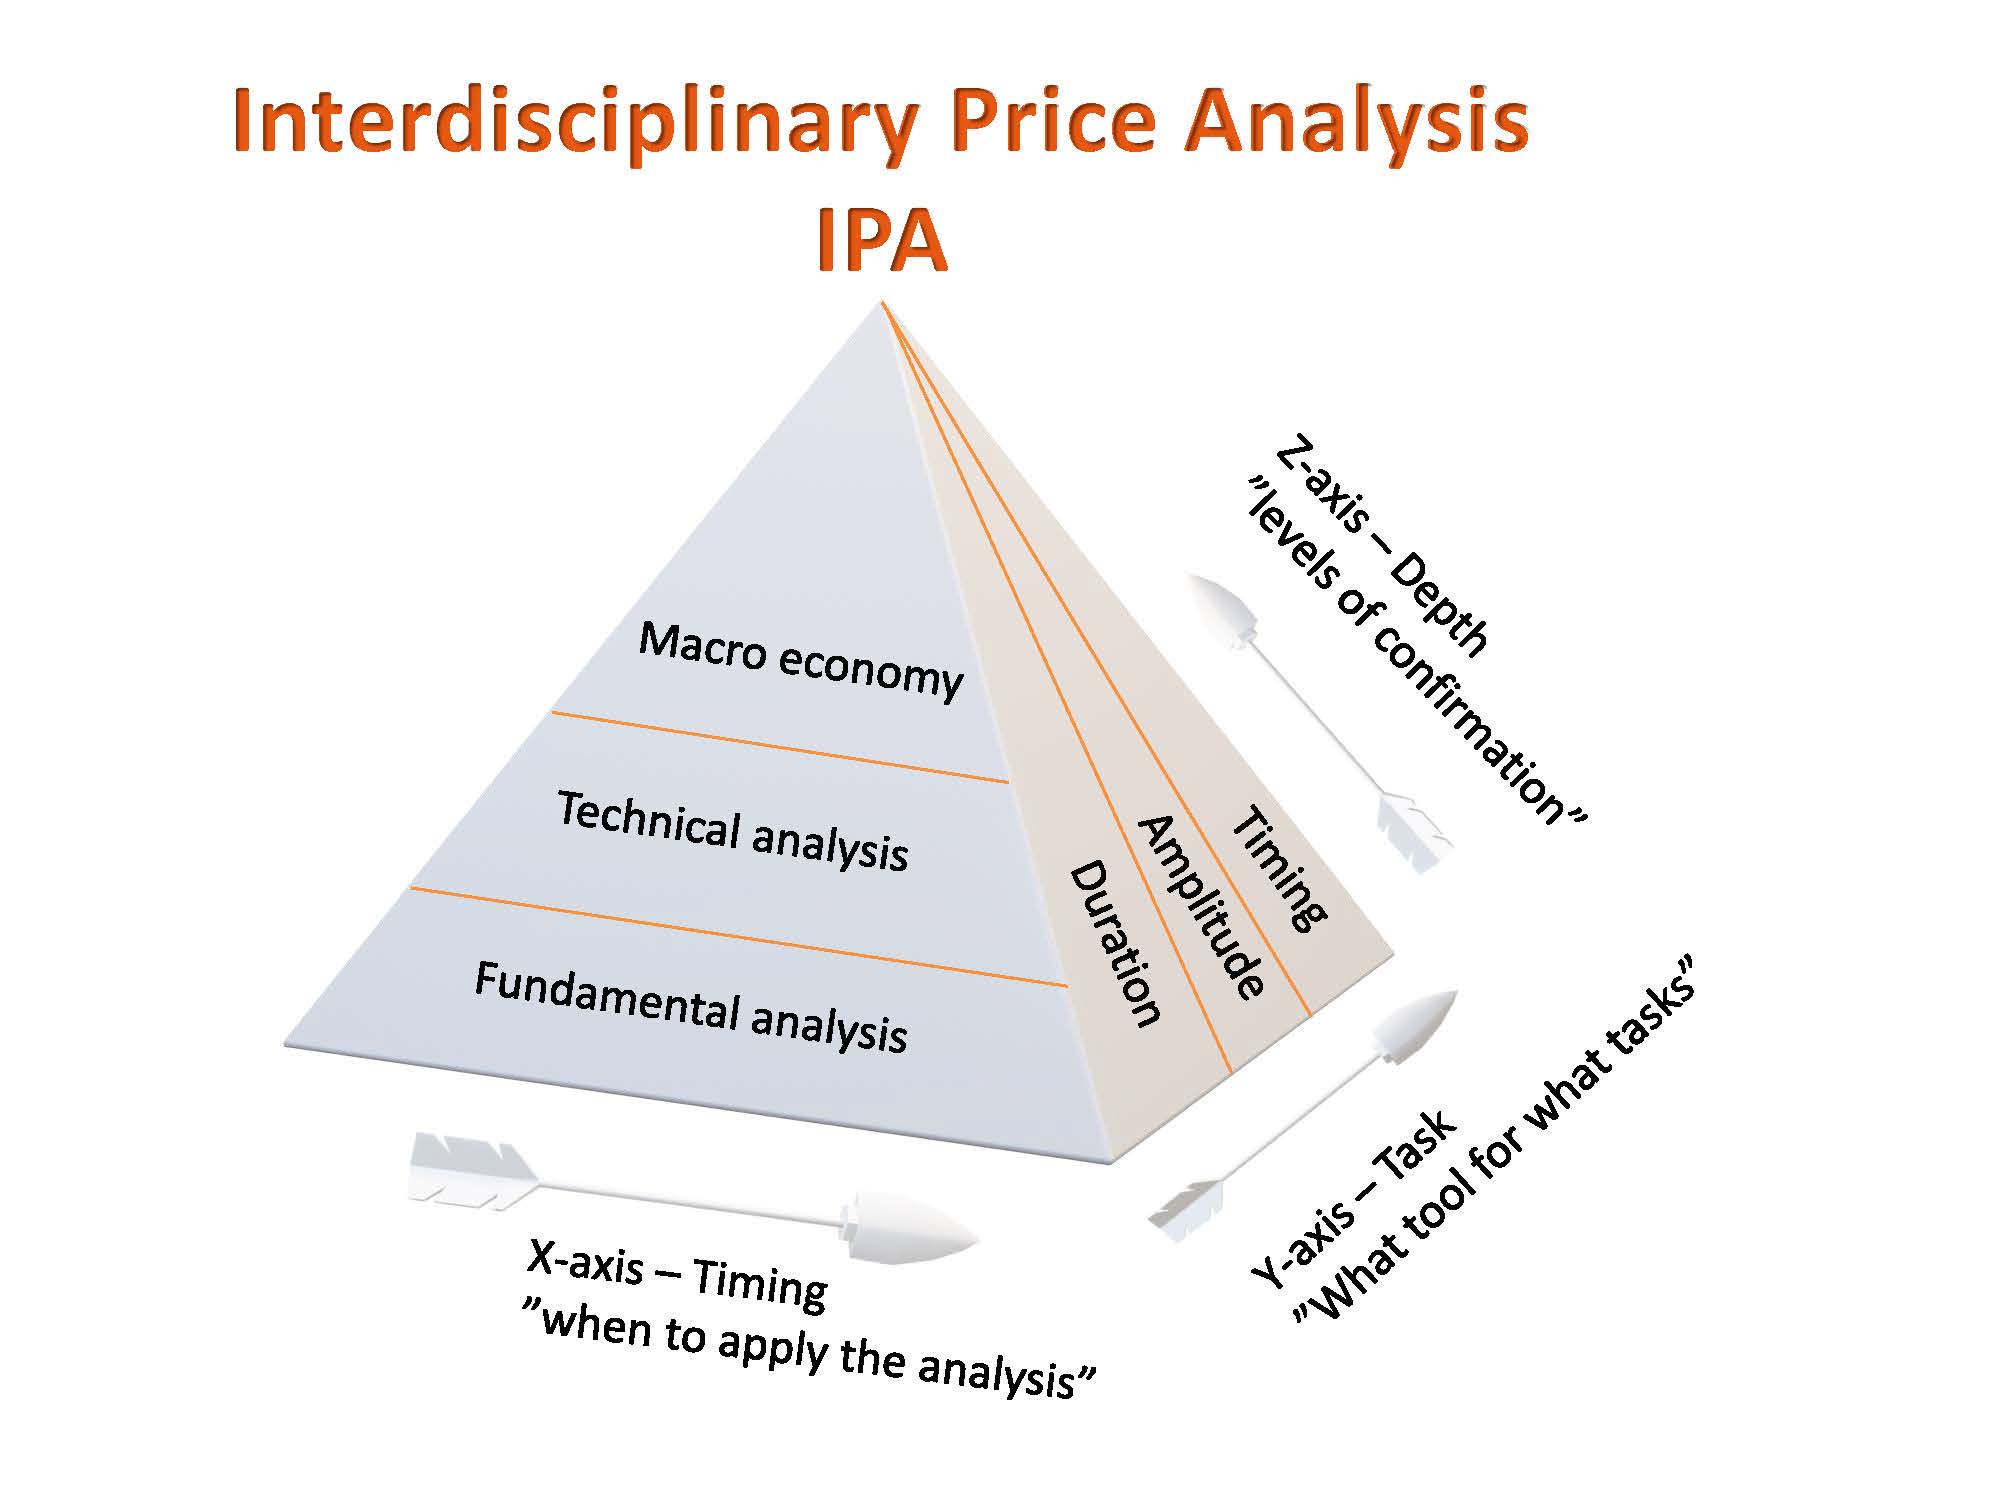
So: His introductory slide was a pyramid, with timing as the X axis, tools as the Y axis, and depth (level of confirmation) the Z axis. Based on these there are only three questions for investors: timing, amplitude and duration. Aligning with this idea he sees depth as a static concept and road map, dynamic signals based on correlation with price the next input, and multiple confirmations encouraging position taking. ‘’The dynamic confirmation of a static forecast is good’’ [his example throughout is of the price of sugar], an idea he returns to in the Q&A session where he thinks the use of Ichimoku charts is ‘’a brilliant combination’’ of a dynamic and static format.
The confirmation methods he prefers are RSI, MACD, and Commitment of Traders reports (COT). For his charts he uses a system called cycleweaver.com where he manually inputs many of the relevant prices series he uses. The economic data, he says, are widely available from the internet from sources like markets.com (and I use FRED, StLouisFed.org).
As for exit strategies, ‘’it all boils down to what is your mission in life’’.
A superb presentation which members of the Society of Technical Analysts are able to watch again and again.
Tags: commodities, confirmation, cycles, Dewey, Elliott Wave, MACD, RSI
The views and opinions expressed on the STA’s blog do not necessarily represent those of the Society of Technical Analysts (the “STA”), or of any officer, director or member of the STA. The STA makes no representations as to the accuracy, completeness, or reliability of any information on the blog or found by following any link on blog, and none of the STA, STA Administrative Services or any current or past executive board members are liable for any errors, omissions, or delays in this information or any losses, injuries, or damages arising from its display or use. None of the information on the STA’s blog constitutes investment advice.


Latest Comments