It’s all in the price – as every technical analyst knows: But how good is your arithmetic?
‘’A basic premise of the technical approach is that market action discounts everything: all that is known, or can be known, is ‘in the price’. Technical analysis is therefore not concerned with the underlying value of a security, but with the effects on the price of that security produced by the activities of market participants.’’ Happily copied and pasted from the STA’s web site.
All fine and dandy, but when you are working with a brand-new security and have no history, what to do? Or if you are faced with markets priced in a volatile currency, how does one approach these? What to do when markets suddenly see tremendous moves? The starting point with these issues comes down to simple comparisons.
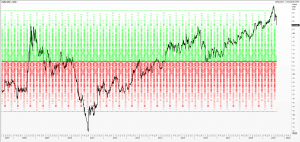
My first chart is of the gold/silver ratio: ounces of silver per one of gold (most often priced, but not necessarily, in US dollars) onto which I have overlaid the mean regression and the 2-standard deviation band. It helps tease out the outperformer or the key driver in the balance between the two. This method could be used across other markets, say edible oils or grains. The soy bean crush is an agricultural perennial – the maths must add up.
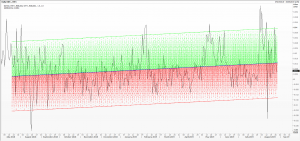
Likewise, we can use spreads: the difference in price between two similar and related instruments. Calendar spreads in money market futures are among the most actively traded anywhere. My chart here is of the difference between the onshore and offshore exchange rate of the yuan against the US dollar. I’ve again added the mean regression and 2-standard deviation band, which is helpful in gauging extremes.
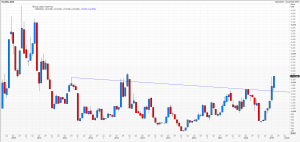
When looking at the freight rates of the Baltic Dry Index say, something many know nothing of, it might be useful to compare these with Baltic Dirty Tanker and Panamax prices. Likewise, with bank shares, compare banks’ share prices in one geography, or in a particular market sector.
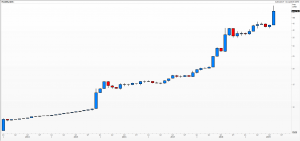
 Finally, looking at something where the price has collapsed suddenly and dramatically: a chart of the number of Argentine pesos needed to buy one greenback. Because the move was so very big this month, I have used a logarithmic scale to adjust for this. Then one looks at the percentage devaluation from a set day – more often than not year-to-date or the last 12 months – and compares this to moves in other currencies. You’ll find that this year only a tiny clutch of currencies has appreciated against the US dollar; from then on, it’s a question of scale.
Tags: Mean Regression, ratio, relative, scale, spread, Standard Deviation, value
The views and opinions expressed on the STA’s blog do not necessarily represent those of the Society of Technical Analysts (the “STA”), or of any officer, director or member of the STA. The STA makes no representations as to the accuracy, completeness, or reliability of any information on the blog or found by following any link on blog, and none of the STA, STA Administrative Services or any current or past executive board members are liable for any errors, omissions, or delays in this information or any losses, injuries, or damages arising from its display or use. None of the information on the STA’s blog constitutes investment advice.
Latest Posts
- Living in a land of large numbers: How to get a grip July 24, 2024
- Debate with ACI UK, The Broker Club & The Commodities Trading Club: Forecasts for the second half – plus marks for first half July 10, 2024
- Retail traders embrace volatility: Zero-day options and penny stocks on today’s menu June 24, 2024
- STA members and their guests get a dose of hypnotherapy June 12, 2024
- ‘And it’s a goal! Again’ Rectangles, corsets and straightjackets May 28, 2024


Latest Comments