


Head the one about Inverse Logic Spectral Analysis? And just in time for Halloween
Tuesday the 10th October 2017 the STA invited Dr Dmytro Bondar to speak at its members’ monthly meeting. His topic: detecting market cycles using ILSA – the spectral analysis of the title. His logic was sound and his mathematics rigorous, as one would expect from an engineer, and he’s so confident in the method that he has a patent pending – GB1709967.2, if you must know.
At the moment, he has only tested it out using sterling/US dollar exchange rate data, from 1989 to 2017, and not intra-day data either. This he plugged into an Excel spreadsheet and using the Fournier equation he transforms a time series into a frequency cycle, sine waves if you like. Using 20, 30, 50 and 100 day cycles he tries to forecast future reversal points.
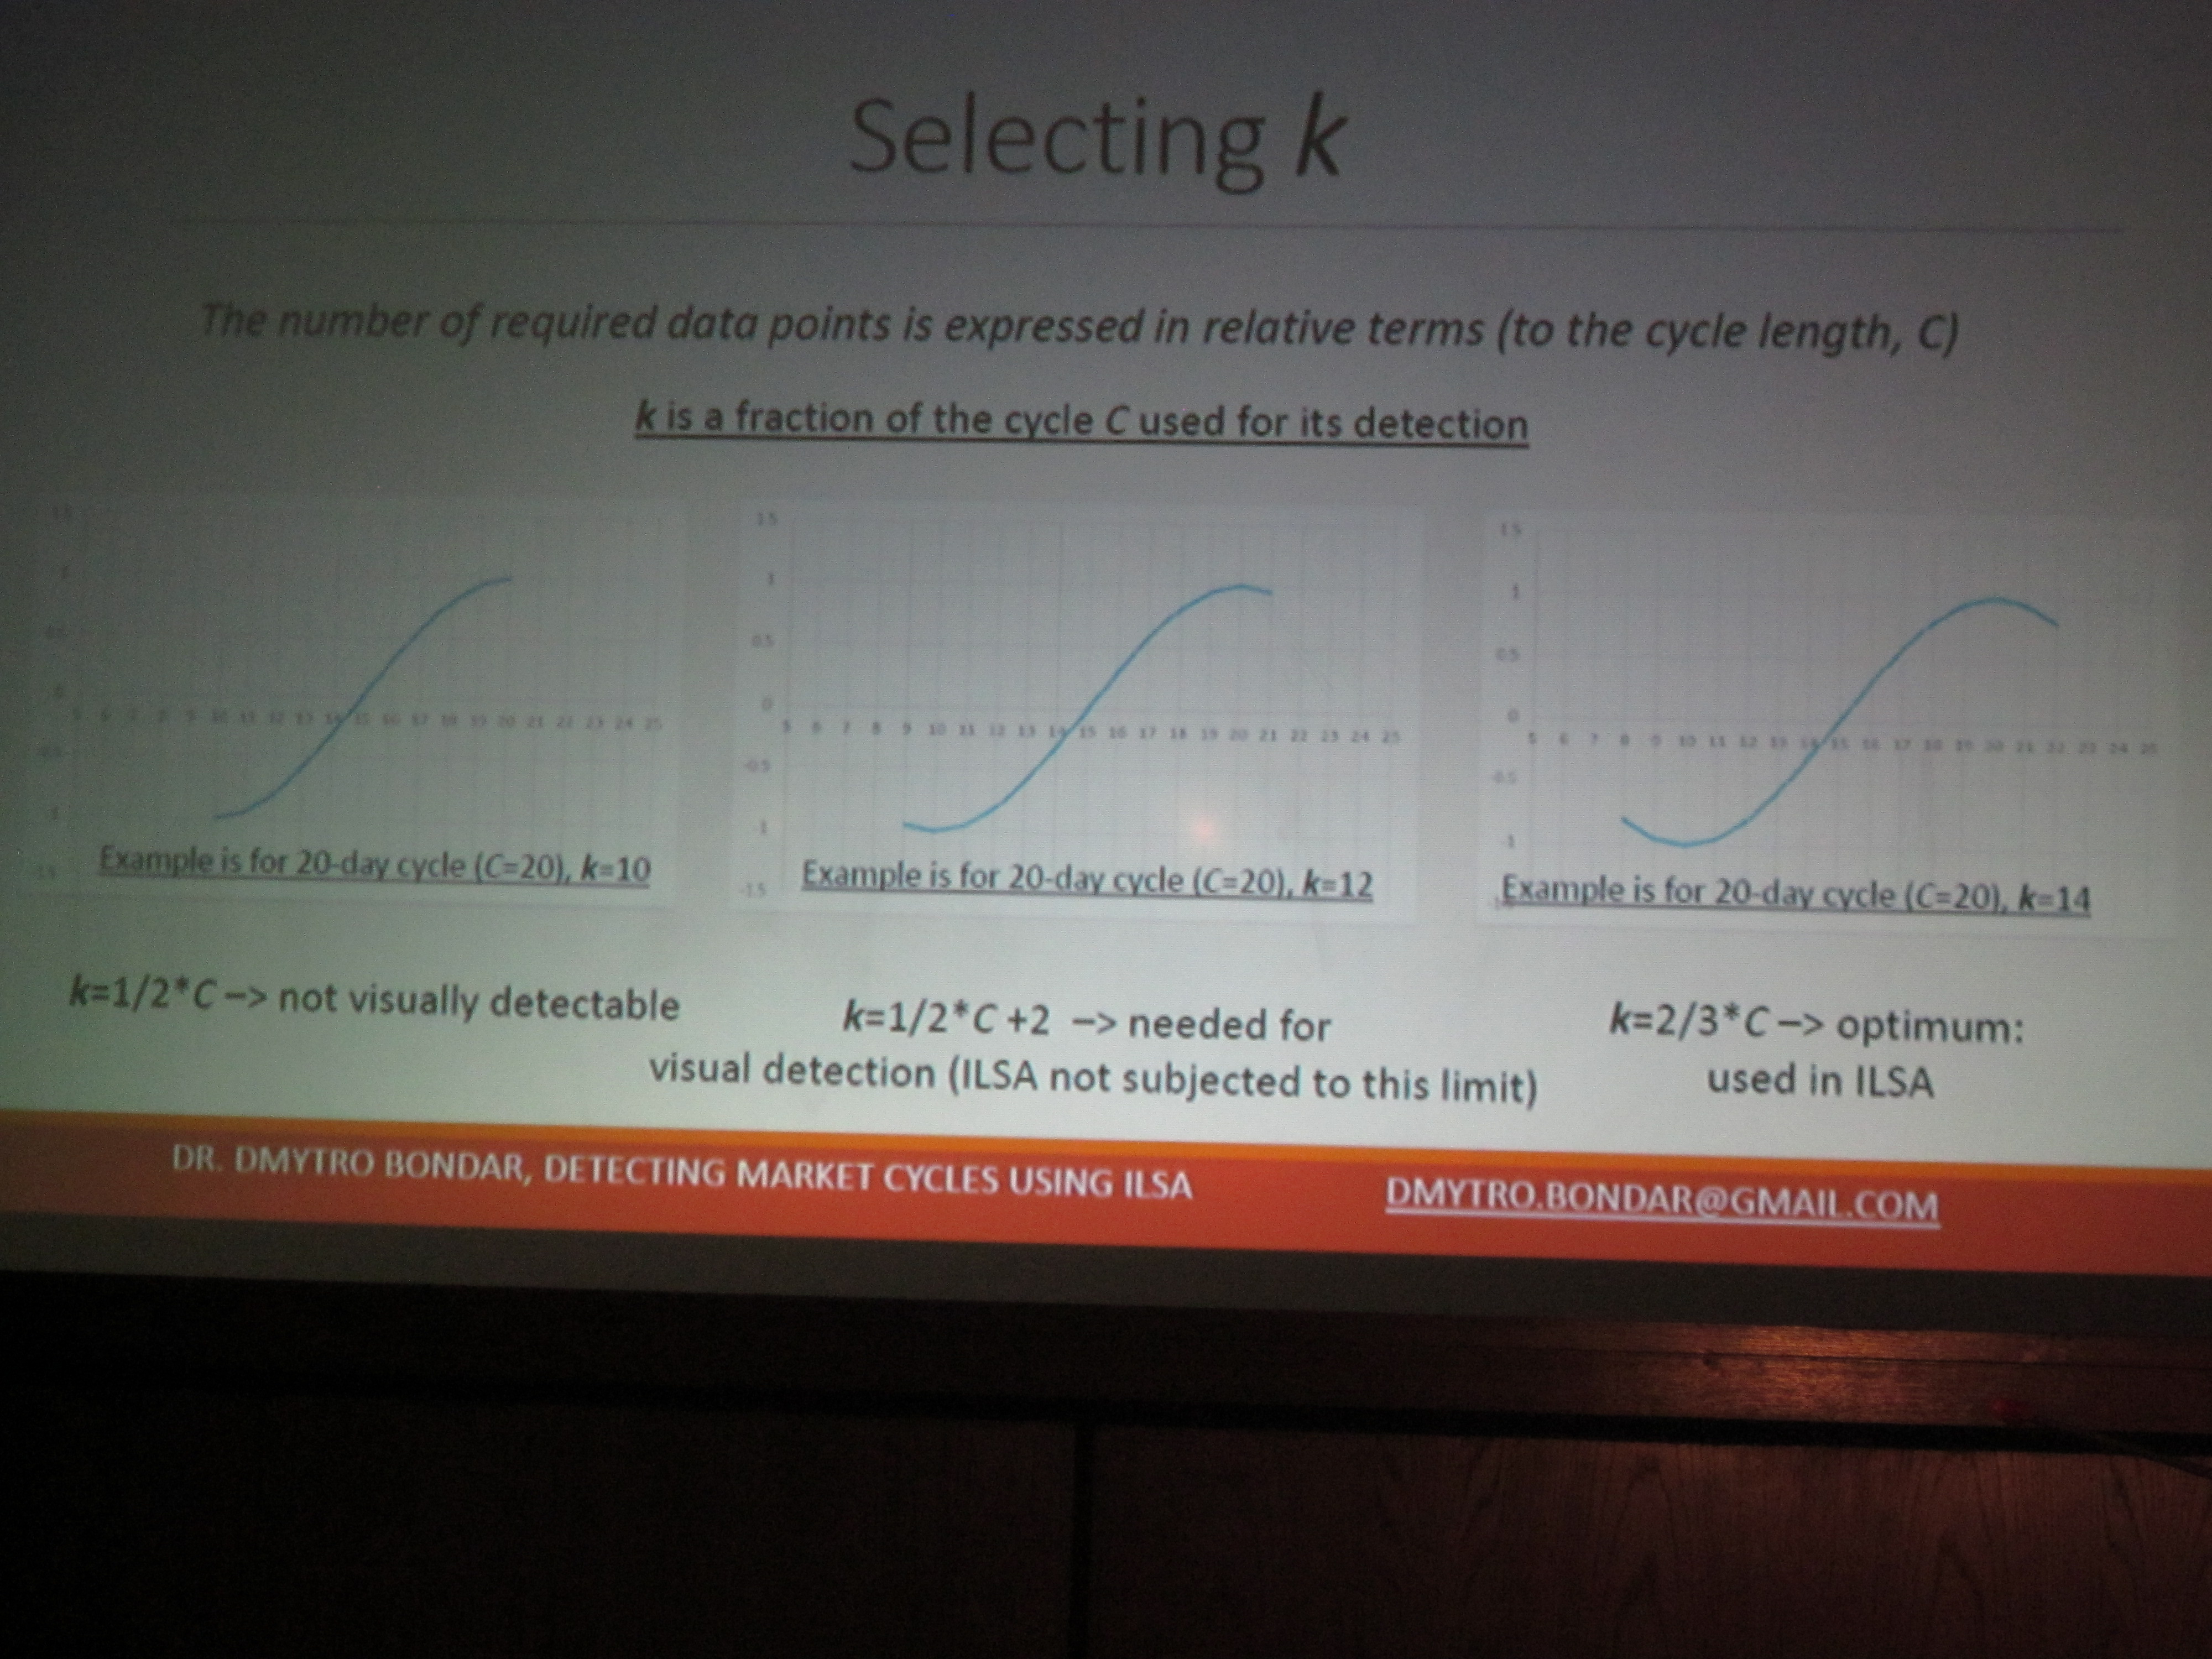
For each cycle he needs data for at least 2/3 of its period to try and forecast turns. Think of it as eyeballing reversals where an interim high and an interim low must be in place before one can say it is turning. While his goal is to detect the dominant cycle, the other ones can cause peaks and troughs not to line up exactly with the market.
He finds that some cycles repeat more often, such as the 20-working day one (equivalent to a calendar month), the 49 day one which is close to Gann’s 7-week cycle, and the 130-working day one which is half a year – 182 calendar days. ILSA takes 128 daily data points, or 180 calendar days.
He readily admits to its current limitations, like once detected a cycle may have already disappeared. He speaks fast and my maths is not all it might be, so do look out for the video of his talk which will give you a much better grasp of his novel approach.
Photographs of some of his excellent slides for this presentation are attached.

Tags: Cable, Fournier transform, Movin g averages, Two thirds
The views and opinions expressed on the STA’s blog do not necessarily represent those of the Society of Technical Analysts (the “STA”), or of any officer, director or member of the STA. The STA makes no representations as to the accuracy, completeness, or reliability of any information on the blog or found by following any link on blog, and none of the STA, STA Administrative Services or any current or past executive board members are liable for any errors, omissions, or delays in this information or any losses, injuries, or damages arising from its display or use. None of the information on the STA’s blog constitutes investment advice.


Latest Comments