


Four UK Chancellors – and counting: Counting the cost of the latest fiasco
A difficult year for the British economy and daunting times for its people. ‘Party gate’ toppled a Prime Minister who had won an election with a very large Conservative majority. It then took months of beauty parades to choose a successor, and in the meantime Queen Elizabeth II died and 10 days of mourning were declared. Now an estimated £60 billion ‘mini’ budget has shredded what little credibility new PM Liz Truss had and she pushed her Chancellor under a bus.
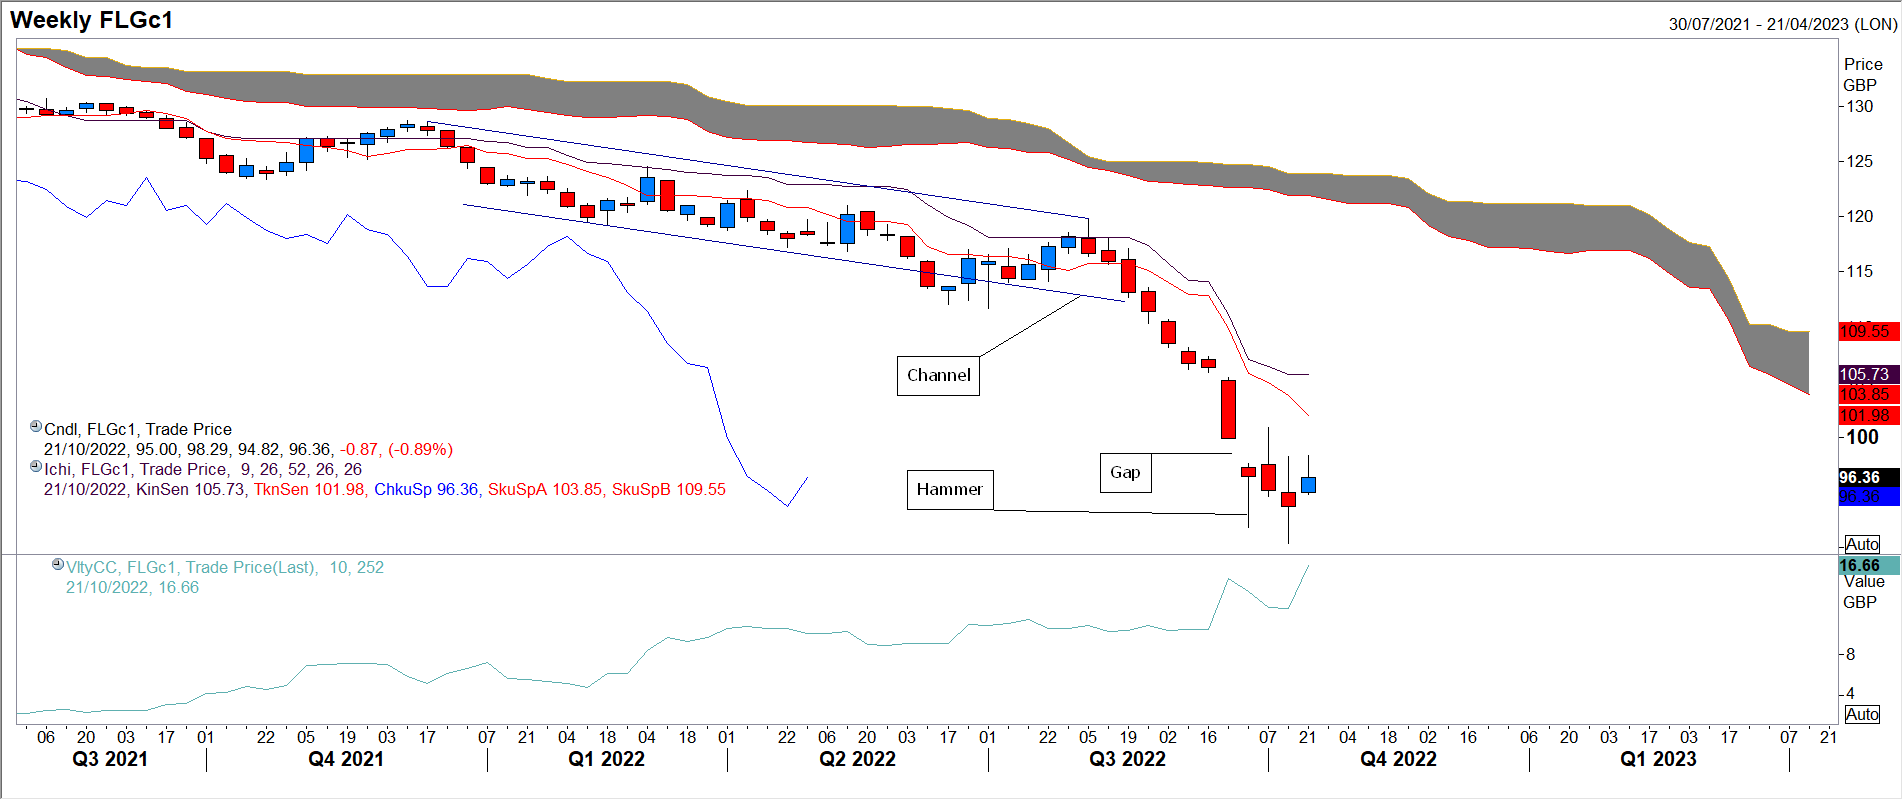
No wonder all things sterling have been febrile, reflected in volatility far higher than one would normally expect. You can see this in my first chart – a weekly one of the front month Long Gilt futures contract (maturity 10 years) – where, on a close-to-close basis, observed (also known as historical) volatility rose from 2.5% in the summer of 2021 to just over 17.0% this week.
On this same chart you can also see that since trading down neatly in a channel since late 2021, the decline picked up the pace in September 2022, gapping lower on the Monday following the details of the mini-budget. A hammer reversal candle was created at the very end of the month, volatility dipping to 12.5%, but rather than rally, prices have merely consolidated under the psychological £100 level and above the recent low at £90.38. Note that this year’s drop, which started at just over £128.00 saw a 29% fall in the value of the gilt future.
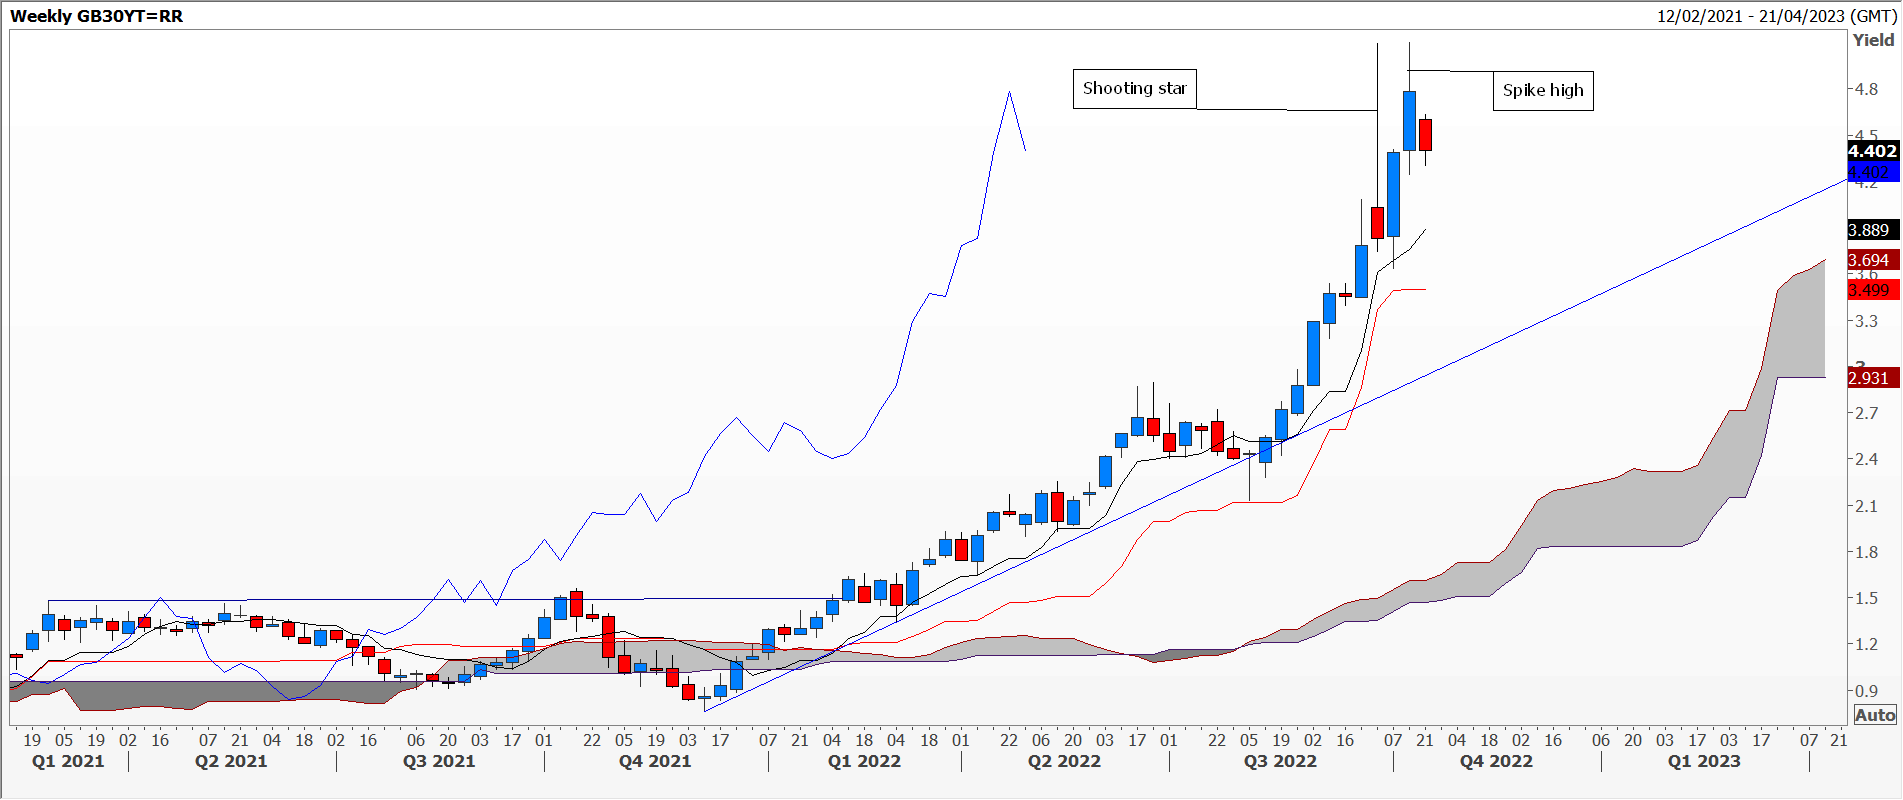
The second chart is the yield on a benchmark 30-year Gilt, where since December 2021 these have rallied from just under 1.0% to a high at 5.1% – a five-fold increase. Here you can clearly measure the asymmetry between price moves and change in yields during sharp moves. Therefore the shooting star is far bigger than the hammer and, despite a second spike high last week, the jury is still out as to whether a turning point is in place.
The views and opinions expressed on the STA’s blog do not necessarily represent those of the Society of Technical Analysts (the “STA”), or of any officer, director or member of the STA. The STA makes no representations as to the accuracy, completeness, or reliability of any information on the blog or found by following any link on blog, and none of the STA, STA Administrative Services or any current or past executive board members are liable for any errors, omissions, or delays in this information or any losses, injuries, or damages arising from its display or use. None of the information on the STA’s blog constitutes investment advice.


Latest Comments