


Fake News: And alarmist headlines
Never mind the ‘fake news’ on social media. Alarmist headlines, sloppy opinion pieces masquerading as reporting, and targeted advertising mean many – like me – are becoming increasingly cynical. On Tuesday morning, in a print version of a free newspaper that I rate (and its editor knows this because we met recently), I saw the following: US equities have been the best-performing investment in 2019 so far, with UK and global equities close behind, a new list has revealed.
The article continues: Government bonds have been the worst-performing asset class so far, losing four per cent of their value, despite being the best-performing in 2018. Inflation-linked and corporate bonds also gave a negative return according to a list released today by the investment management provider Fidelity International.
Now, why am I unhappy with this story? Why did I stop and question its validity – as I say, it was published in a paper I like and has a large, well-respected investment house as its data source. I know US equity markets have rebounded strongly from the Christmas bloodbath and, as always, the faster they fall the bigger the ping back of the elastic band. I still wasn’t convinced. I thought I knew where to find this year’s star asset class.
I thought it would be in China-facing equity indices, which had had a particularly torrid time starting in January 2018. Sure enough, they’d done well, but was it good enough? The quickest and most reliable way to compare is via what Reuters calls ‘rebasing’ charts. You choose the assets you want to compare, the start and end dates, and price them all at a nominal 100 on day one so that percentage gains and losses are plotted.
I started using these a lot when comparing the performance of base metals, grains and oilseeds – not being a stockbroker myself. It’s also great when comparing banks, oil companies and utility company performance. This month it’s been especially interesting comparing the change in yield, and the change in price, of G10 sovereign bonds.
These are Fidelity’s figures:
Asset class Total return (per cent) US equities 6.75; UK equities 6.57; Global equities 6.15; Real estate 6.10; European excluding UK equities 5.34; Asia Pacific equities 5.11; Emerging market equities 4.39; Commodities 1.99; Japanese equities1.57;High yield bonds1.25;Emerging market debt 0.97; Cash 0.16; Corporate bonds -1.93; Inflation-linked bonds -2.51Government bonds -3.98.
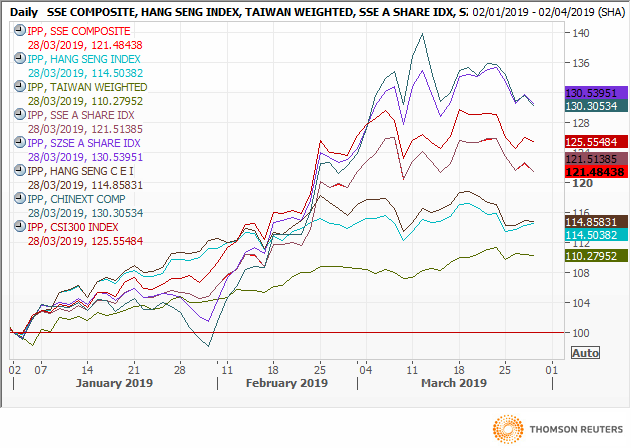
Instead: I offer you a few rebasing charts. The first is that of China-related indices, where the best performers this year are the Shenzhen A share and ChiNext Composite, up 30 per cent; at the bottom, Taiwan.
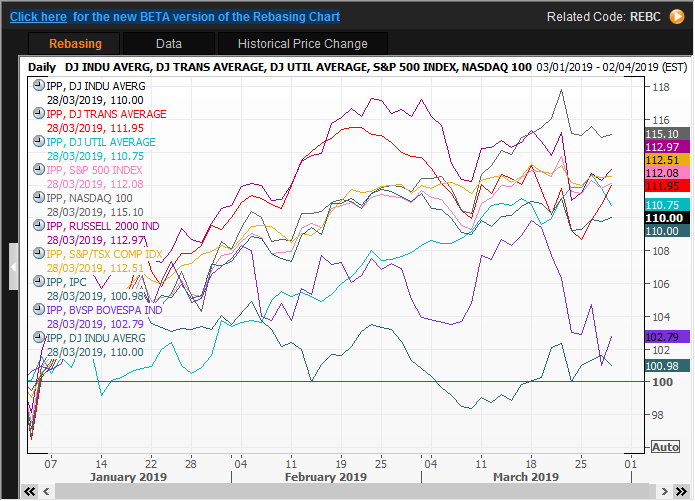
My second chart is that of indices in the Americas, which includes Mexico’s IPC in bottom place and Brazil’s Bovespa up just 2.5 per cent, while Dow Industrials gained 15 per cent. I could go on, but I think you catch my drift.
The views and opinions expressed on the STA’s blog do not necessarily represent those of the Society of Technical Analysts (the “STA”), or of any officer, director or member of the STA. The STA makes no representations as to the accuracy, completeness, or reliability of any information on the blog or found by following any link on blog, and none of the STA, STA Administrative Services or any current or past executive board members are liable for any errors, omissions, or delays in this information or any losses, injuries, or damages arising from its display or use. None of the information on the STA’s blog constitutes investment advice.


Latest Comments