


Do you know Aroon? I do, but not very well
I’m not one to promote or push one form or another of technical analysis – especially when it comes to oscillators. I find the choice of what to use – and what’s rubbish – can lead to heated arguments. Personally, I prefer to stick as closely as I can to price action as what I really, really want to see is fear and greed. But I have to admit that, when markets are a bit ‘blah’ as I’m finding them this year, I need crutches.
But with so little momentum I’m finding my usual favourites have little to add. I don’t use anything secret or special, just the usual stuff in a bog-standard tool box. The usual suspects, like a couple of moving averages (which I’ll happily ditch when I feel like it), MACD, RSI. When things get really tough the Commodity Channel Index and Aroon.
The latter, I see rarely in generally available analysis. Whether it’s unknown or unused, I don’t know. But if it’s the former, here’s a quick summary for you to catch up and then test out to see if it’s for you.
According to Investopedia.com, a site I can recommend (and another good one is Stock Charts), it’s a way of measuring when a market’s trending and how strong the tendency is.
https://www.investopedia.com/terms/a/aroon.asp
Developed by Tushar Chande relatively recently (hence me thinking some readers might not have heard of the method), it consists of two lines covering (usually) a 25-day period which move between 0 and 100: the up one, how long it’s been since a new recent high, the down one, time since a new low. Therefore, up line above down line equals bullish and vice versa. Line crossovers suggest a change in trend.
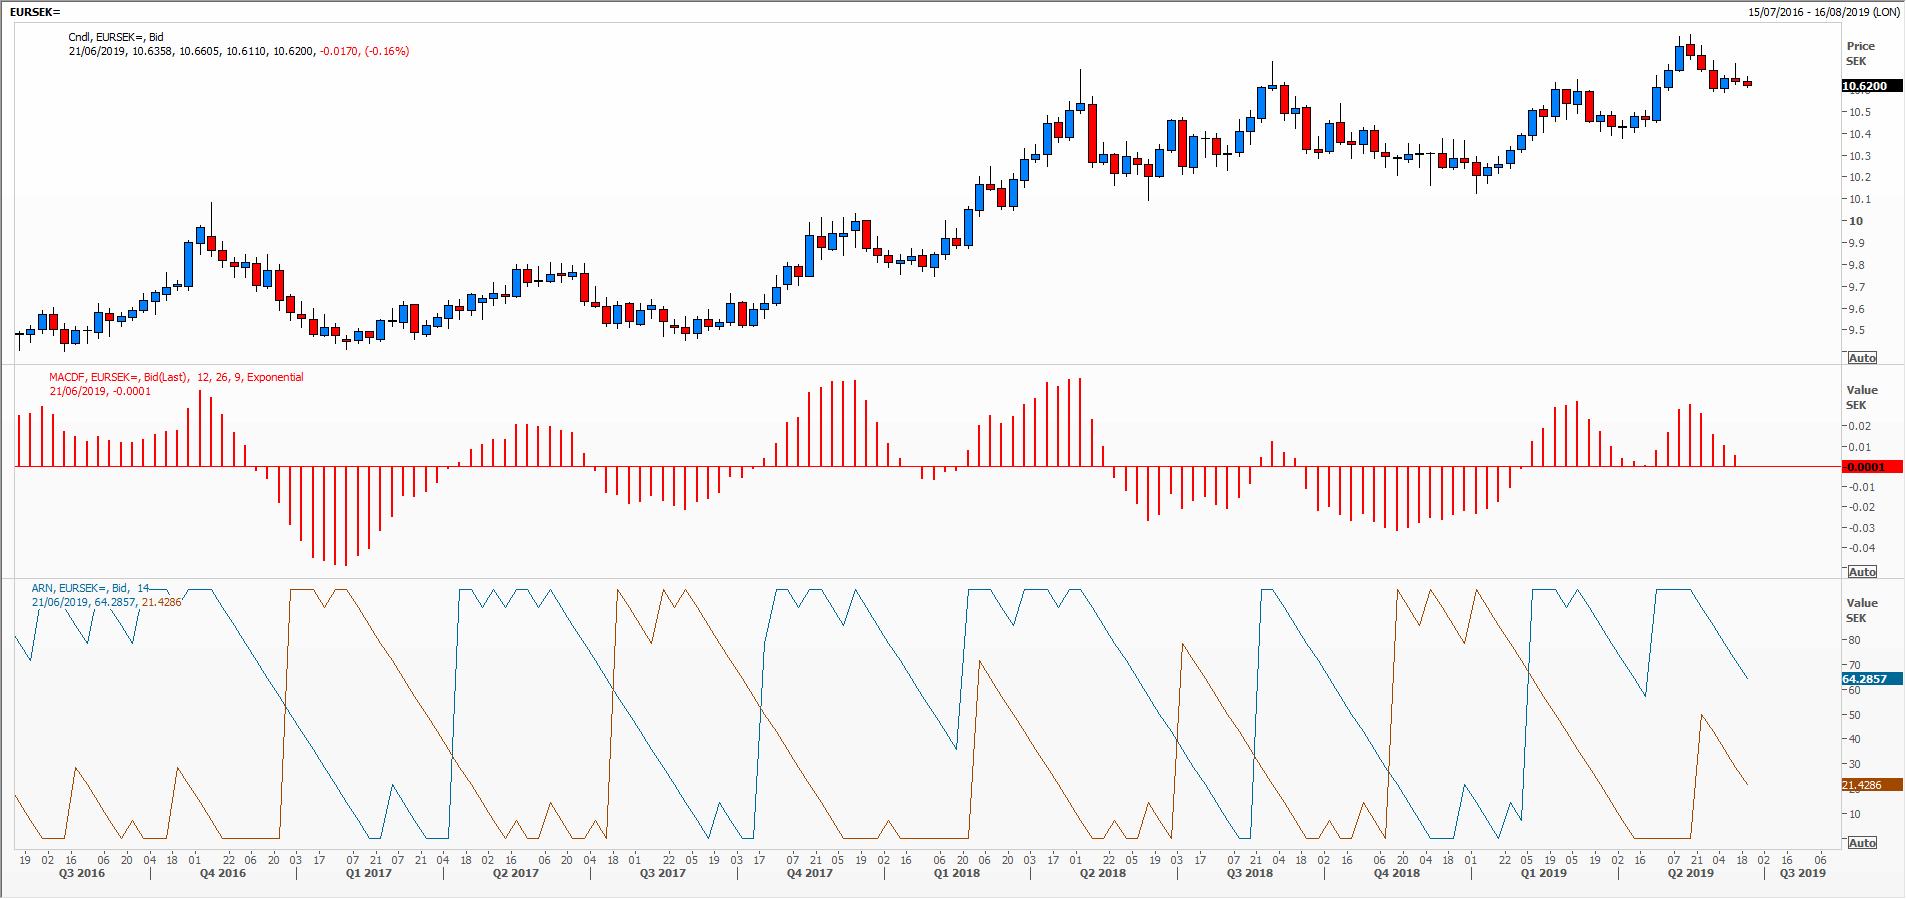 The attached chart is hopefully a market you’re not familiar with, the Swedish krona against the euro. I find this helps one approach a new technical analysis method with a neutral frame of mind. I’ve also added the MACD so you can see the similarities between these methods.
Tags: Aroon, oscillators, Trends
The views and opinions expressed on the STA’s blog do not necessarily represent those of the Society of Technical Analysts (the “STA”), or of any officer, director or member of the STA. The STA makes no representations as to the accuracy, completeness, or reliability of any information on the blog or found by following any link on blog, and none of the STA, STA Administrative Services or any current or past executive board members are liable for any errors, omissions, or delays in this information or any losses, injuries, or damages arising from its display or use. None of the information on the STA’s blog constitutes investment advice.


Latest Comments