


Barrage of data ahead of US Thanksgiving: With Thursday’s holiday and Black Friday to come
As part of our series looking at how financial markets prepare and react to economic data, I’ve picked today – Wednesday the 24th November 2021 – because lots of US data meets a long weekend. This can often lead to unexpected outcomes and desperate covering of unwanted positions.
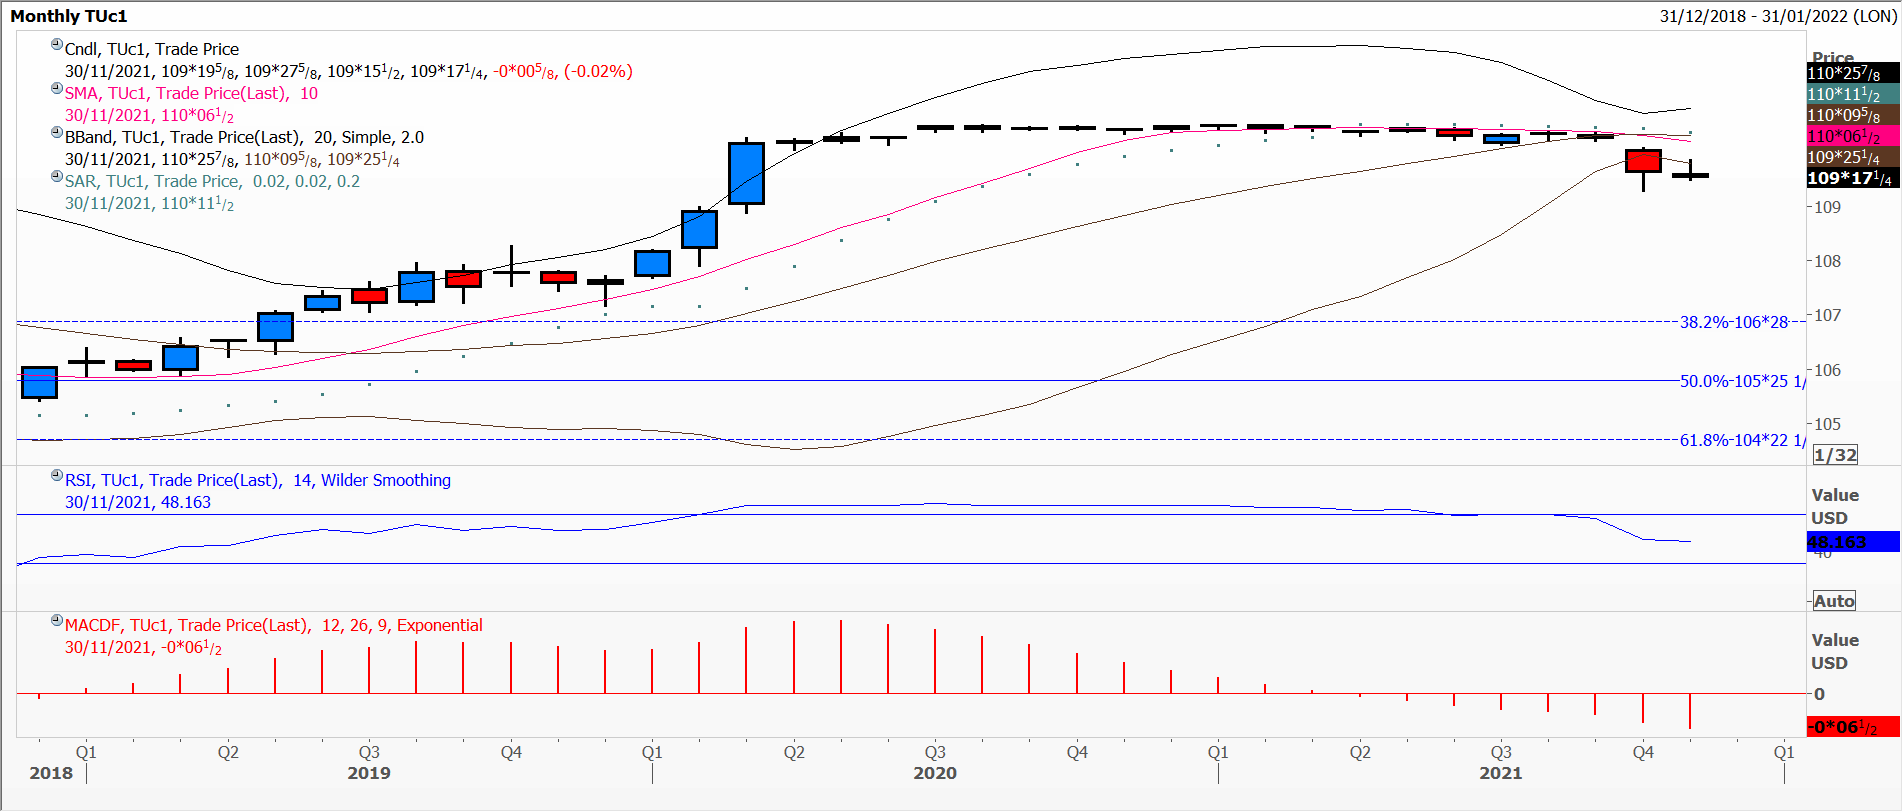
Today’s background is one of complacency. Well, maybe not today exactly but the US dollar money markets (and others) have woken up to a situation they have not seen in a very long time. My first chart is a monthly one of the front month US Treasury 2-year futures contract. As you can see, sleepy hollow for so long that most interns and recent graduate hires know nothing else. Cue: shock and awe!
Data today at 08:30 US Eastern time included the American October trade balance, which declined sharply (to the relief of many in the administration) to a deficit of $82.9 billion from a record $98.2 billion the previous month. Note: this compares to a pre-pandemic gap of $58.0 billion in March 2020.
Weekly jobless claims slumped from a revised 270,000 to 199,000 which I’m told is the lowest since 1969; continuing jobless claims from 2,109,000 to 2,040,000. I think you’ll agree that all these numbers are a small plus for the USA.
An hour and a half later we had another round coming at us, including personal income, spending, core personal consumption expenditure and new home sales, all for the month of October. Suffice it to say these were higher than in September, especially spending which increased by 1.3% from a strong 0.6% rise the prior month.
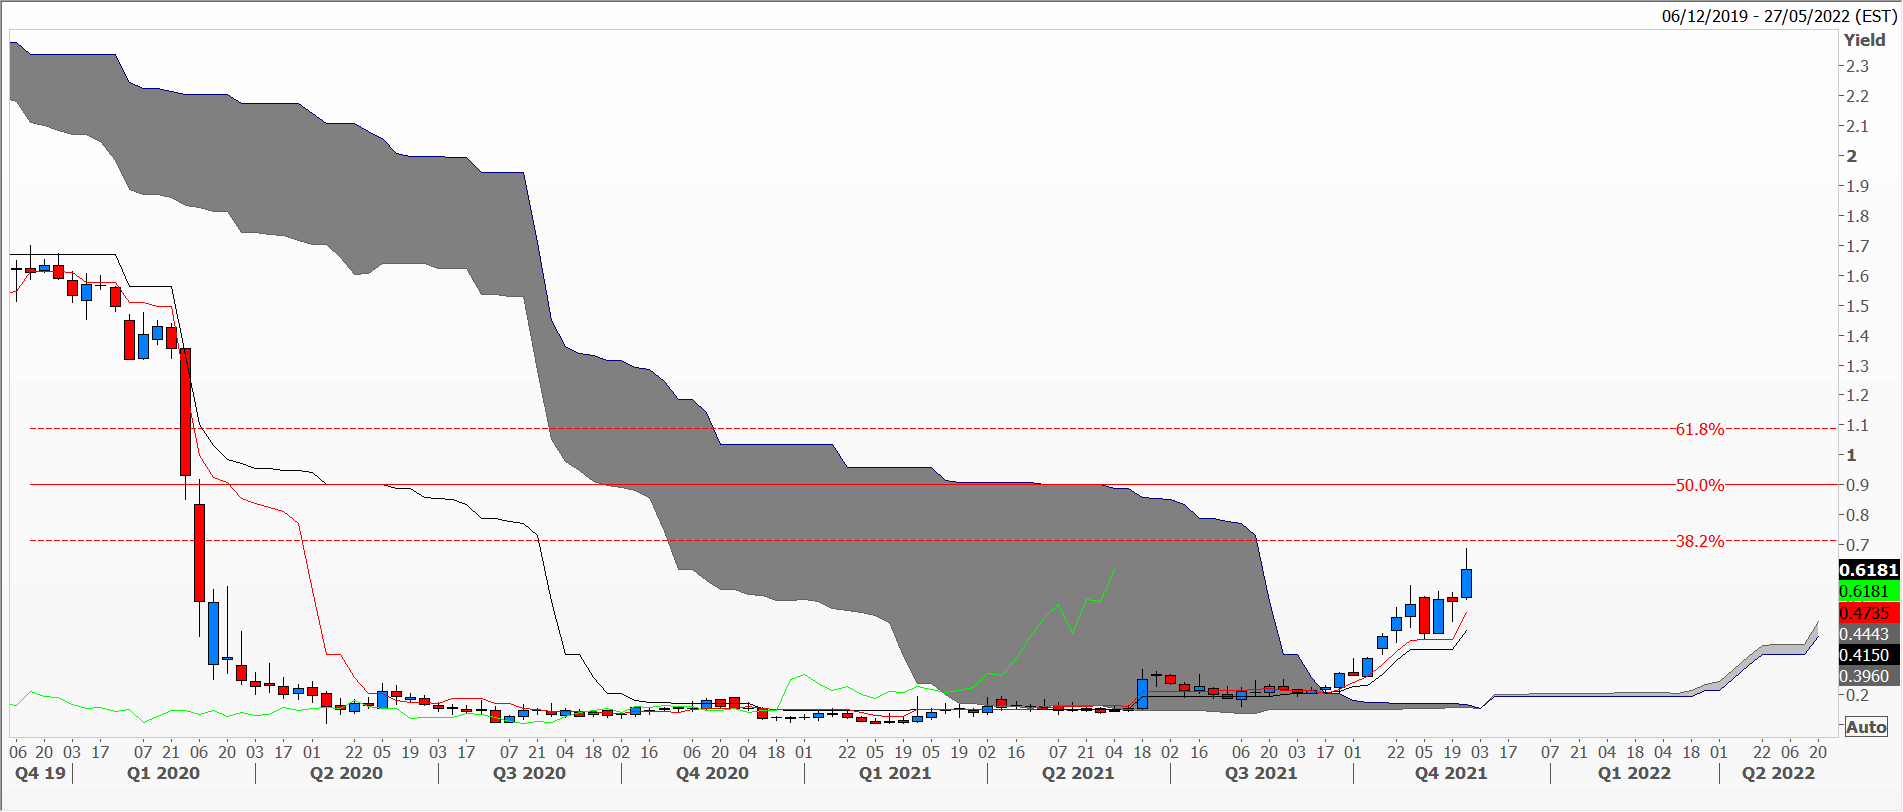
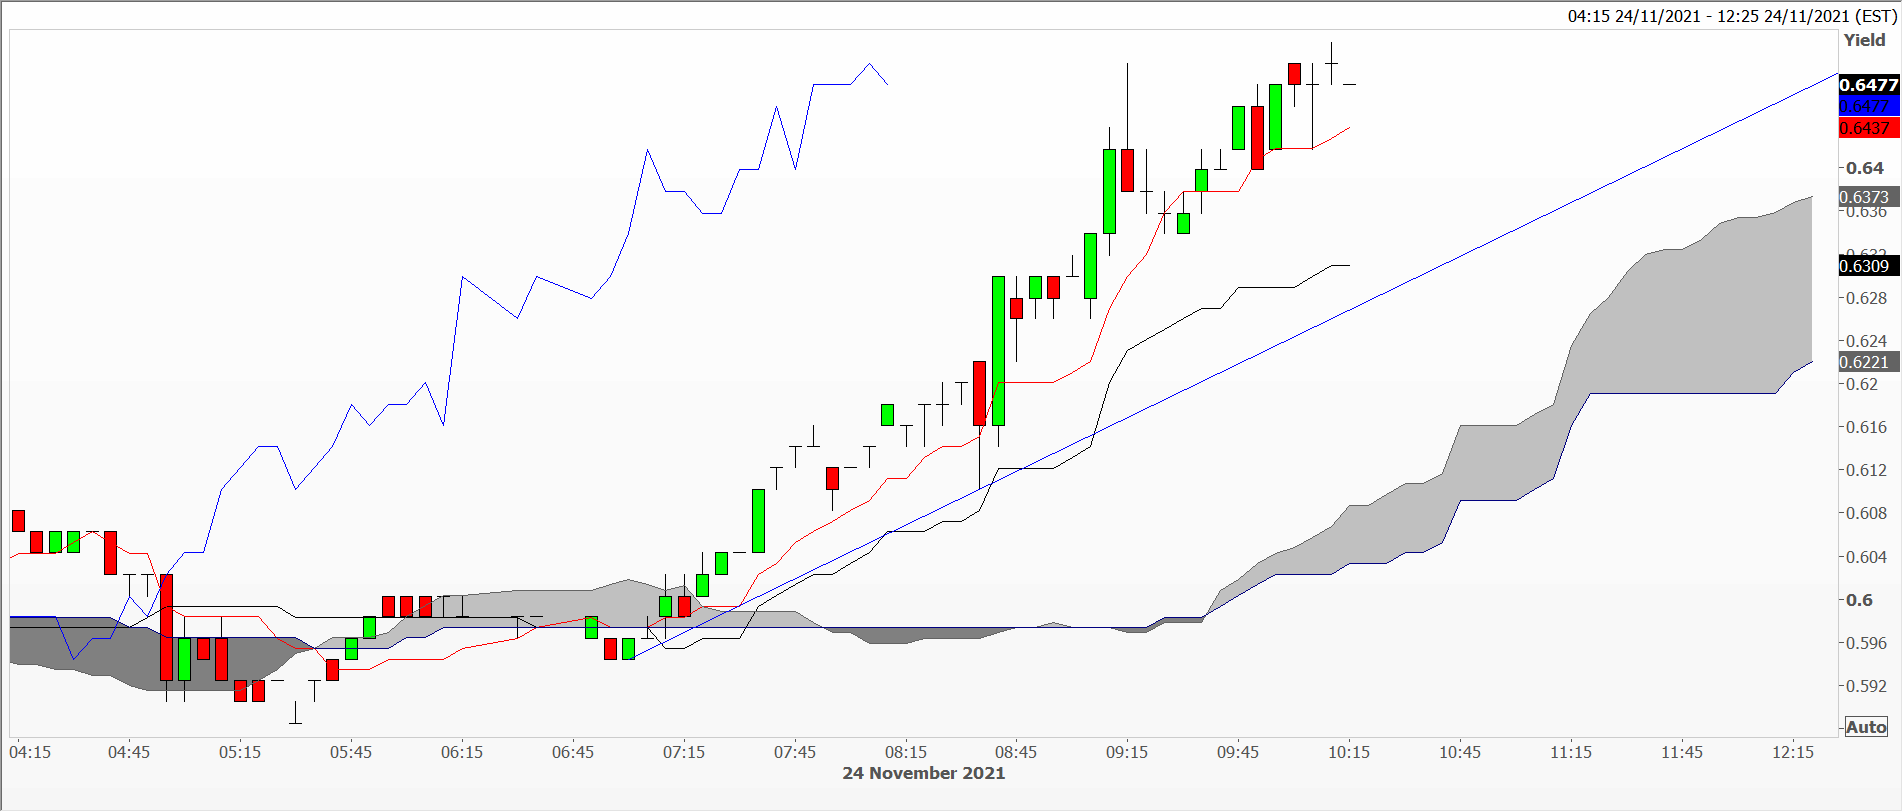
Benchmark 2-year yields, which had started edging higher since June from a low at 15 basis points on the weekly chart, touched 65 basis points today, their highest since pre-pandemic days. The 5-minute chart sees a steady rise in yields since the New York opening today. I know we’re dealing with very small numbers, but this move represents a big rise of a key rate to borrowers. How would you be feeling if your monthly mortgage repayments had quadrupled since this summer?
US2YrNoteFuture
US2YrYield
US2Yr_5mins
Tags: Complacency, nerves, surprise, the Federal Reserve, unprepared
The views and opinions expressed on the STA’s blog do not necessarily represent those of the Society of Technical Analysts (the “STA”), or of any officer, director or member of the STA. The STA makes no representations as to the accuracy, completeness, or reliability of any information on the blog or found by following any link on blog, and none of the STA, STA Administrative Services or any current or past executive board members are liable for any errors, omissions, or delays in this information or any losses, injuries, or damages arising from its display or use. None of the information on the STA’s blog constitutes investment advice.


Latest Comments