


On balance volume: and its variations
I’m sure I’m not alone in scouring car number plates trying to spot fun or cool ones; I know that people pay good money for these. The best I’ve ever seen was on a matching pair of his ’n her Rollers parked outside Lord McAlpine’s London home with the plates: ‘2 B’ and ‘NOT 2 B’. My old car’s one was ‘X 254 OBV’ which I thought very apt for a technical analyst, though to be brutally honest it’s not a study I use that often.
Last month STA members had the chance to hear Paul McLaren explain how he uses volume at price to highlight trading opportunities as support or resistance levels give way. Next week we’ll be hearing Rajan Dhall tell us about finding value across asset classes using volume profile. With this in mind I thought it time to remind readers about Joseph Granville’s On Balance Volume.
The market veteran outlined many ideas in his 1963 book ‘Granville’s New Key to Stock Market Profits’ (Prentice Hall) including this simple but effective way of monitoring volume as compared to price moves. Rather than plotting total volume as a histogram below a line chart of closing prices as we usually do, daily closes are assigned a positive or negative value depending on whether they are up or down from the previous one. After picking a random starting value, say 10,000, a running total of the actual volume is plotted, adding or subtracting each day’s worth depending whether it was an up or down day for the closing price.
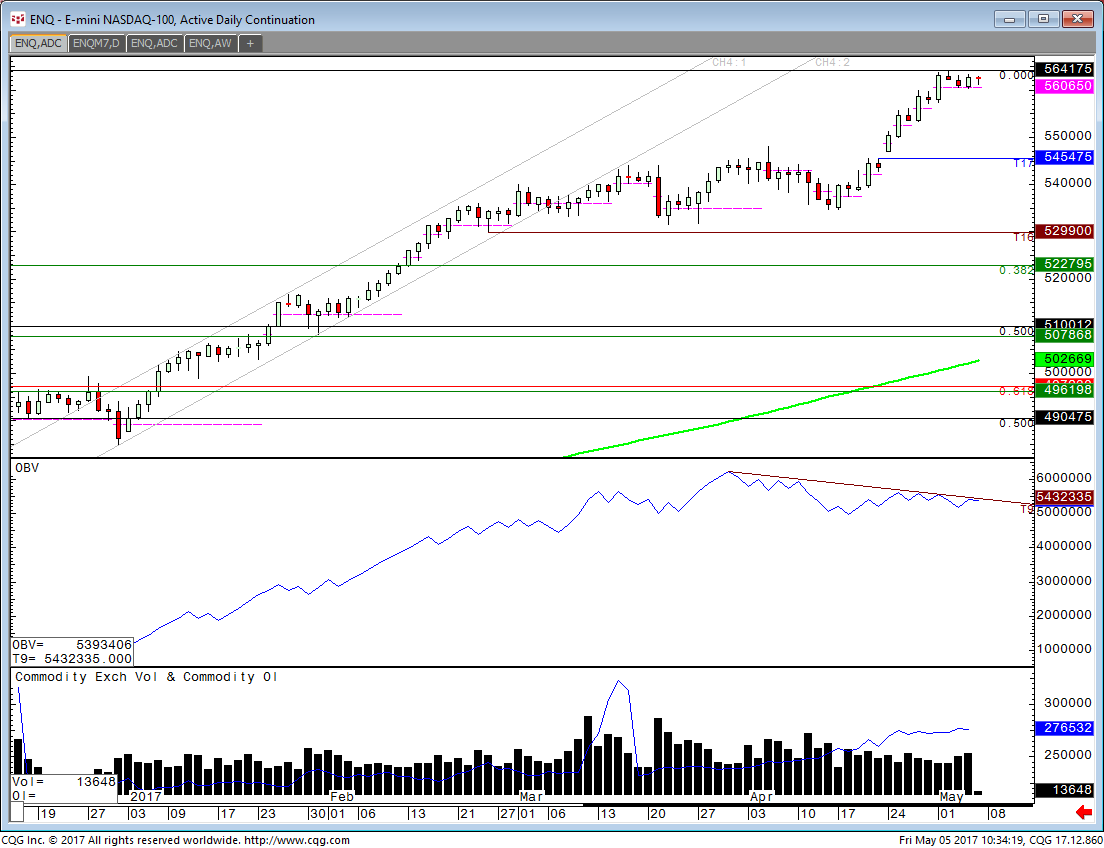
Like so many other oscillators, what you are then looking for is whether volume confirms price action or if it diverges – and thus flashes a warning signal. Absolute volume numbers are not what matters, it is the overall trend in these. Nor does it matter if the number is positive or negative; direction of travel is the key.
Traditional technical analysis can be carried out on the OBV line itself, looking for support or resistance levels, drawing of trend lines and watching for significant breaks. Some people even add moving averages. In fact it all sounds so neat and simple, I think it might be high time I included this in my standard tool kit!
Tags: balance, divergence, volume
The views and opinions expressed on the STA’s blog do not necessarily represent those of the Society of Technical Analysts (the “STA”), or of any officer, director or member of the STA. The STA makes no representations as to the accuracy, completeness, or reliability of any information on the blog or found by following any link on blog, and none of the STA, STA Administrative Services or any current or past executive board members are liable for any errors, omissions, or delays in this information or any losses, injuries, or damages arising from its display or use. None of the information on the STA’s blog constitutes investment advice.


Latest Comments