


Back to the 1970s: A timely article for the Market Technician
Even some economists will admit that when it comes to timing, technical analysts have the upper hand. This was rammed home to me when, post-holiday, I turned to read my March 2023 copy of our magazine, the Market Technician issue 94. Delivered by email to all STA members on the Ides [15th] of March, I was delighted to see that Lou Brien, ‘Strategist/Knowledge Manager’ at DRW Trading Group was looking back at how US markets had reacted when then new Fed Chairman Paul Volker stepped into the job.
Volker picked up the baton in August 1979 when US Consumer Price Inflation (CPI) was racing towards its highest post-war levels and the greenback was close to its weakest ever. Likewise in 2022-2023 many countries have faced their highest levels of inflation in four decades or more, something the media are continuously reminding us of. Meanwhile recent sharp interest rate rises by the US Fed saw the dollar rise to its strongest against many other major currencies in a generation.
I attach the annotated chart accompanying Brien’s article, one of the many valuable pieces of information contained in his succinct article. Starting with cautious, incremental increases in the Fed Funds target rate, this then 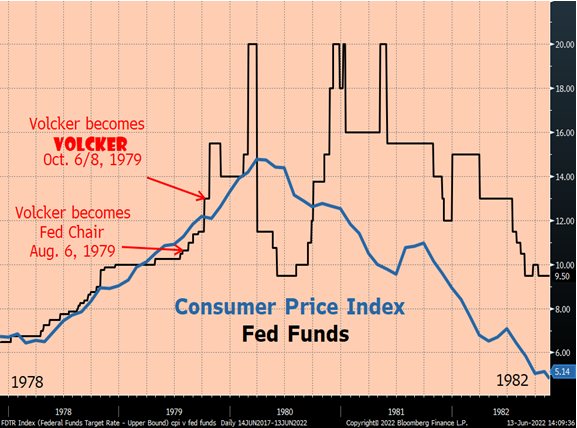 surges at year-end 1979 and early 1980, doubling from 10% to 20% as CPI hit 14%. During this period emerging market sovereigns were urged to borrow longer term as US Treasury bond rates were well below those of US T-Bills.
Mortgage rates today in the US and Europe are much higher than they have been for the decade after 2012, as the Fed and European Central Bank tighten. Chasing out-of-control inflation, they have created the most severe belt-tightening for consumers in ages, too-often blaming it on President Putin and supply chain constraints.
While not at double digits, interest rates have more than doubled, one of the mathematical effects of small versus large numbers, negative interest rate targets making the sums even more mind-boggling. Similarly, observed volatility in money and fixed income sovereign paper is close to its highest in ages, especially when measured by the yield rather than the price of the paper.
Plus ça change!
If you want to read the article, click here.
Tags: Central banks, Historical data, volatility
The views and opinions expressed on the STA’s blog do not necessarily represent those of the Society of Technical Analysts (the “STA”), or of any officer, director or member of the STA. The STA makes no representations as to the accuracy, completeness, or reliability of any information on the blog or found by following any link on blog, and none of the STA, STA Administrative Services or any current or past executive board members are liable for any errors, omissions, or delays in this information or any losses, injuries, or damages arising from its display or use. None of the information on the STA’s blog constitutes investment advice.


Latest Comments