


Asset class returns: From JPMorgan
I know this isn’t pure technical analysis but I thought you might be interested in some recent research from the bank’s Asset Management division which I received. If nothing else it is a salutary lesson in how careful one must be and how a ‘broad brush’ approach might not be a) the best and b) might benefit from a thorough look at the charts. The sources for their data are published below the table.
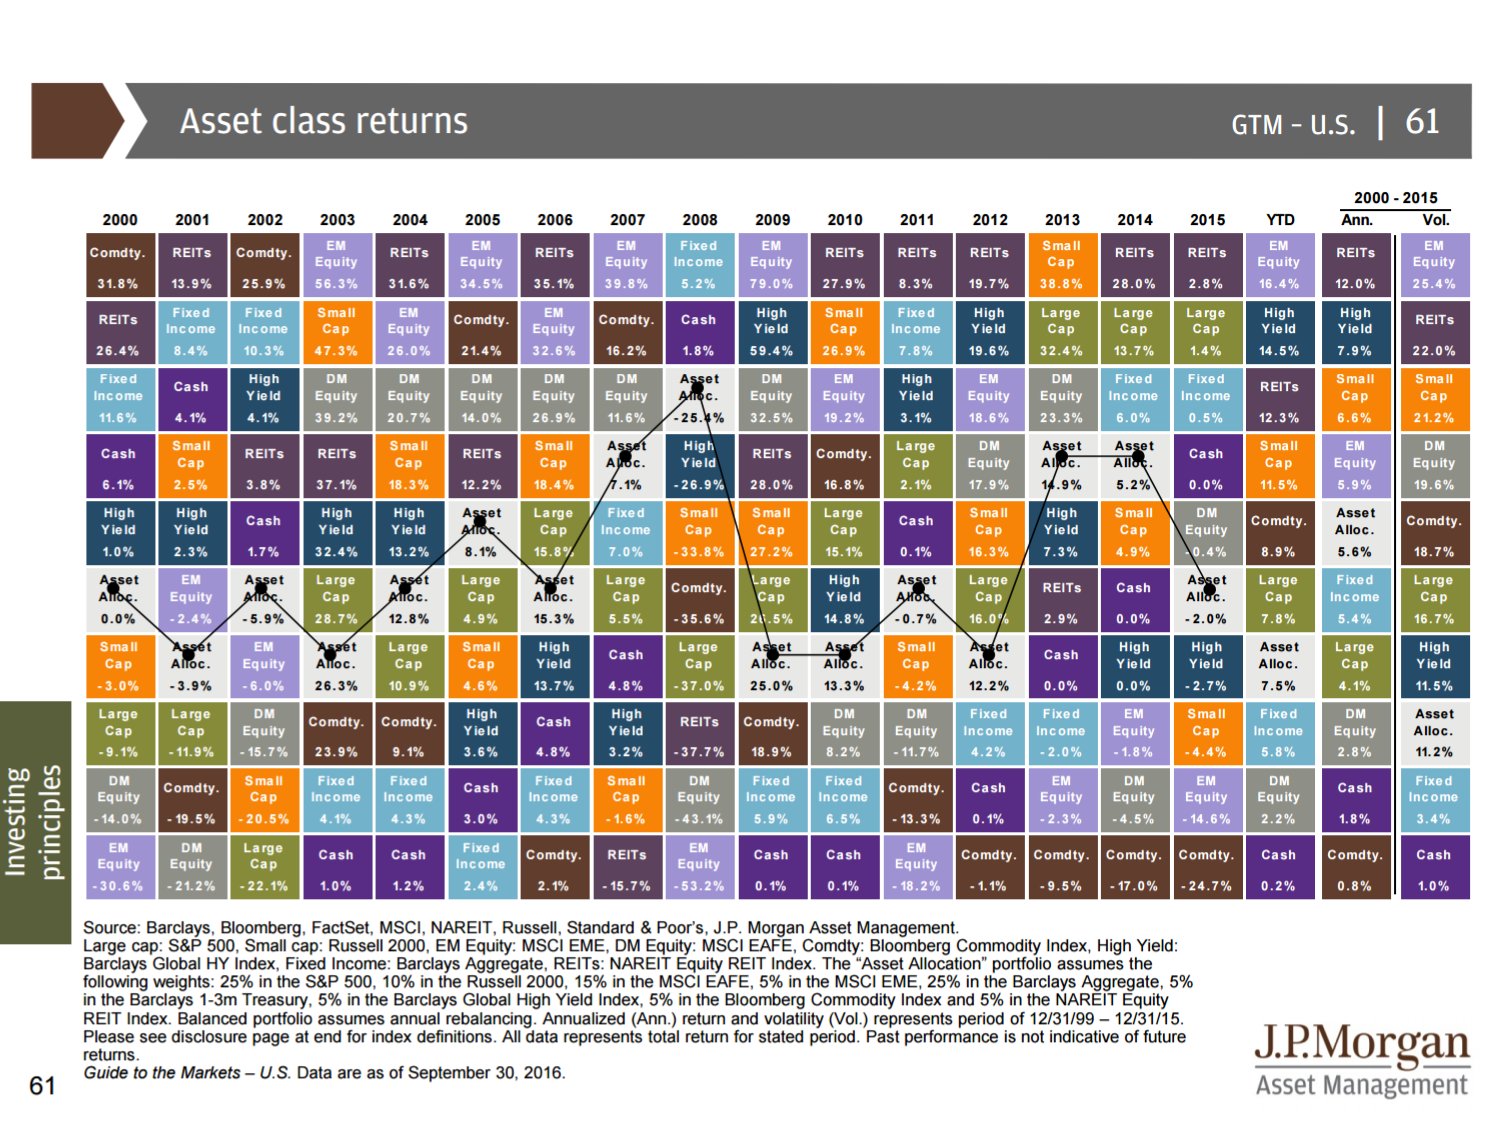
In columns starting in the year 2000, annualised rates of return for ten different asset classes are plotted, including their in-house one (the white boxes). The best performers for each year are at the top, the others in descending order. Annual variations are huge and quite shocking, emerging market equities down 53 per cent in 2008 only to return a whopping 79 per cent the very next year.
Some years are good for every class bar none, many turn out to be a mixed bag with anything from up 25 to down 22 per cent between the top and bottom for that year. A few years have been really grim with 8 out of ten posting double digit losses.
The column on the very far right is worth a close look as it measures the historical volatility of each class over this 16 year period. Perhaps not surprisingly emerging market equities are at the top and cash at the bottom; fixed income a little notch above that reaffirming the theory that older investors ought to hold these.
The column just to the left of volatility plots annualised returns over all the years and will probably be considered rather pedestrian compared to the 5 to 10 per cent most investors have imprinted on their brains. My hunch is that the longer the range of annualised periods studied the smaller the returns and the closer they will map each other.
For technical analysts it’s probably a good idea to keep these last two columns in mind when picking your favourite market at the start of the year; refrain from being overoptimistic. It’s also worth thinking of when working out measured targets for predicted trends.
Tags: Asset classes, performance, returns
The views and opinions expressed on the STA’s blog do not necessarily represent those of the Society of Technical Analysts (the “STA”), or of any officer, director or member of the STA. The STA makes no representations as to the accuracy, completeness, or reliability of any information on the blog or found by following any link on blog, and none of the STA, STA Administrative Services or any current or past executive board members are liable for any errors, omissions, or delays in this information or any losses, injuries, or damages arising from its display or use. None of the information on the STA’s blog constitutes investment advice.


Latest Comments