


Are you any good with the Greeks? Matt Cowart has a way with these and shares his insights
The STA’s May monthly meeting yesterday, 9th, saw a slick web-based presentation by Matt Cowart, founder and CEO of Rocket Scooter (‘’a nod to made in my garage’’). From an engineering background, his interest in trading US stocks started in 2010 and his current firm now has 22 people he can call on and who are currently developing many new ideas this year.
He sits surrounded by bulky hardware in a serious, green-walled studio. He speaks fast but very clearly and is very much at ease in this environment. The reason for this becomes evident as he goes on to tell us that he has a YouTube channel, speaks daily about the charts, is active on social media, and is offering STA members a special introductory offer of a 3-month trial at $35 per month (www.rocketscooter.com)
Claiming to be an AI Scanner and Algorithmic Charting package, he focuses on options on US equities. Data is supplied on a close-of-business basis by the Options Price Reporting Authority (OPRA). This is an 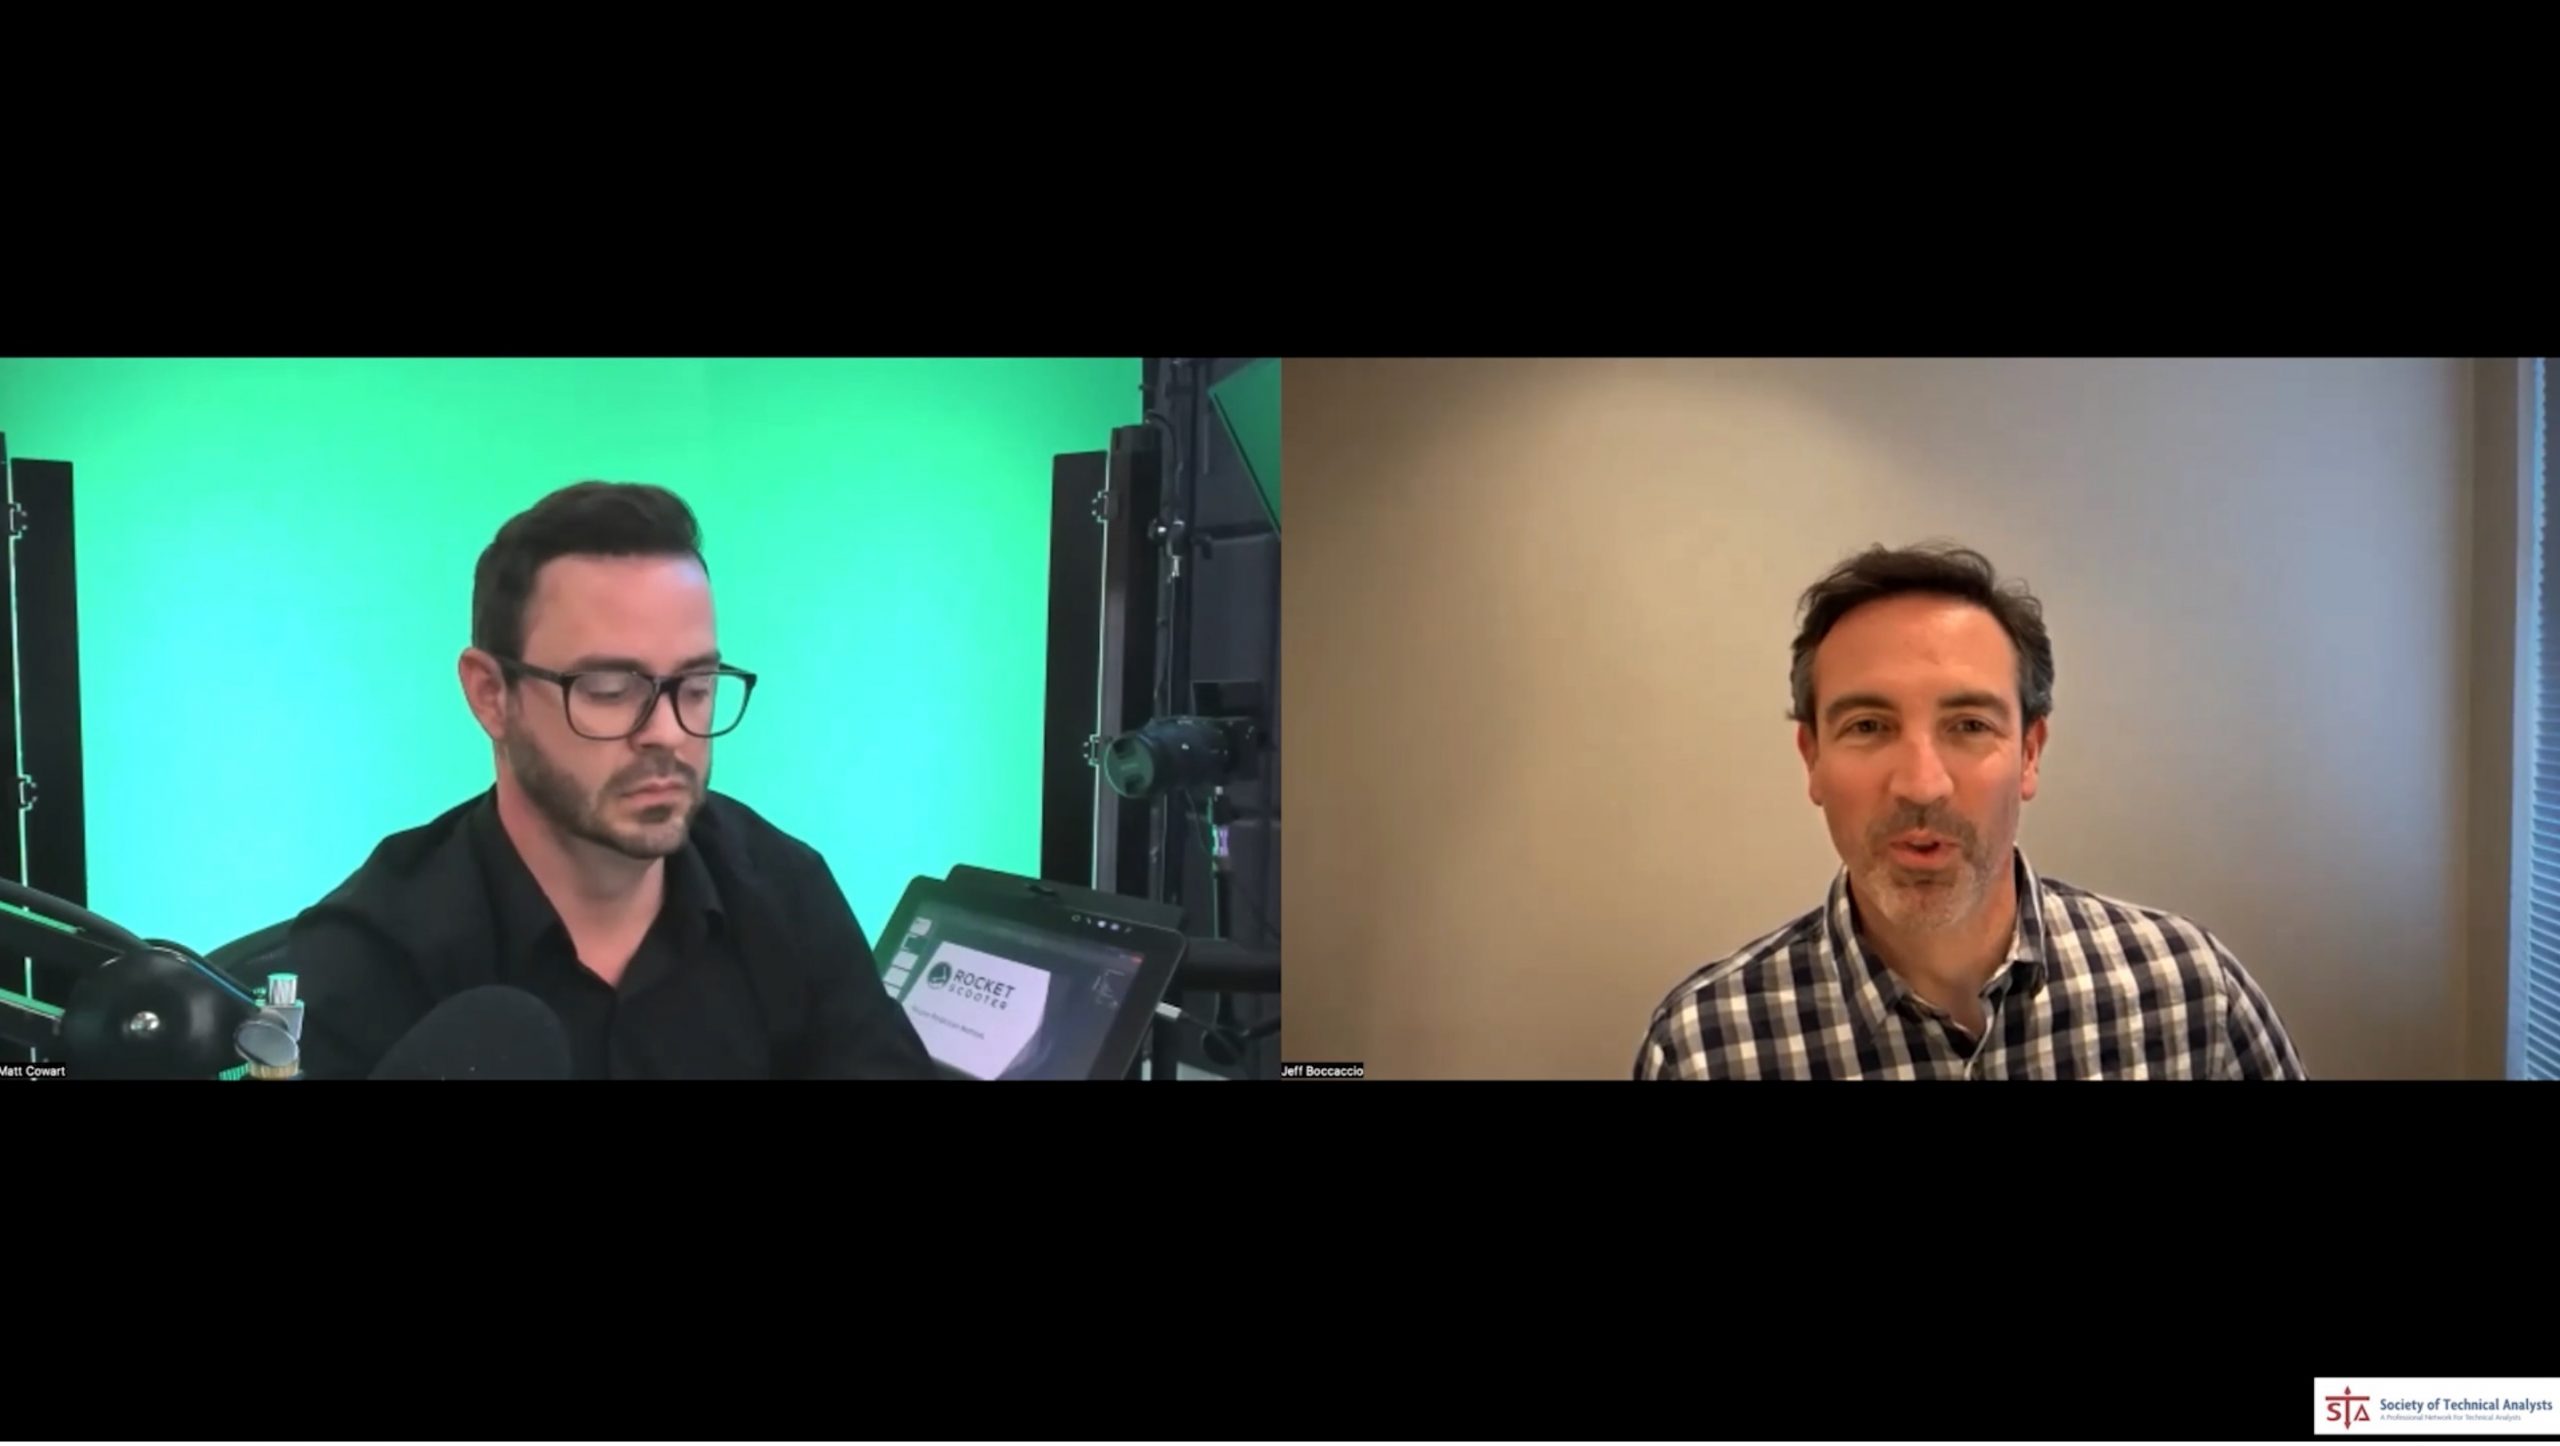 aggregator of exchange data from 8 US option exchanges, supplying both executed trades and bid and offer quotes with their respective volumes. Technical analysis software is from Trading View (which he rates highly).
He is not really predicting price direction, but gauging where buyers and sellers lie; think of it sort of as volume profile or the order ladders supplied by CFD brokers. He says this is easier to do with options as one knows the strike price, though how exactly he discovers who ‘smart money’ is, I’m not so sure. Concentrating on delta in illiquid markets, the key to his system – which understandably remains a bit of a black box – is the Liquidity Map, followed by a daily outlook (DD) and a monthly one (BLU). Some of his jargon is a bit silly, like ‘’call wall’ and ‘’people are longing’’.
His own trades are all carried out by 14:00 hours (Chicago time, I’m guessing) and have an average duration of 20 to 30 minutes. The intra-day price charts he shows us are all basically rectangles with a series of oscillators and proprietary measures along the way. Something I think boffins and geeks might enjoy.
Tags: options, Orders, volume
The views and opinions expressed on the STA’s blog do not necessarily represent those of the Society of Technical Analysts (the “STA”), or of any officer, director or member of the STA. The STA makes no representations as to the accuracy, completeness, or reliability of any information on the blog or found by following any link on blog, and none of the STA, STA Administrative Services or any current or past executive board members are liable for any errors, omissions, or delays in this information or any losses, injuries, or damages arising from its display or use. None of the information on the STA’s blog constitutes investment advice.


Latest Comments