


The year 2022 in words and charts: Dismal indeed
Most fund managers will admit that 2022 was a ‘difficult’ year; few will admit that if annual report cards were given out (as schoolteachers give to parents) the summary would read FAIL. Even fewer will go as far as admitting that current investing mantra might need reviewing or that it is plainly wrong.
The current narrative reads: sclerotic global supply chains and the aftermath of Covid, plus the war in Ukraine, have caused a ‘cost of living crisis’. Central banks, belatedly realising that inflation wasn’t transitory, hiked key interest rates adding to the stress on business and consumers.
Now is an excellent time to look carefully at your long term charts to see whether, and to what extent, market action bears these ideas out – thinking objectively before you are inundated with a barrage of new narratives for 2023. I tend to look at the deepest and most liquid exemplars of their kind, often the ones with the most historical data.
Nearly all stock indices are down on the year, most between about 10% and 20%, hardest hit the US NASDAQ -33%, China’s Chinext -27% and the South Korean Kospi -26%. At the other end of the spectrum are Argentina +236% and Turkey +285%, stocks being a tried and tested hedge against inflation and currency devaluation.
Top quality corporate and government bonds have also lost about 10% to 20%, even inflation-linked bonds unable to hold up against a barrage of distressed sellers. Nearly all currencies have weakened against the US dollar, somewhere in the order of less than 10%. As for commodities, most were trading on Friday at less than where they started the year, most dramatically lumber -66%, oats -46%, and coffee -25%.
Gainers were US crude oil +6%, gasoline +10% and alarmingly rice +25%. At my local discount supermarket butter, milk and spaghetti have all doubled in price.
I’ve picked out three of the many charts I could have chosen. Cable (US dollars per UK pound) because so much noise was generated when in September it hit a new record low just above $1.0300 (two standard deviations below the mean regression since 1982). It subsequently rallied (as did other major currencies) and has attempted a very unconvincing hammer reversal; the 2020 one was much clearer but failed to create any bullish momentum.
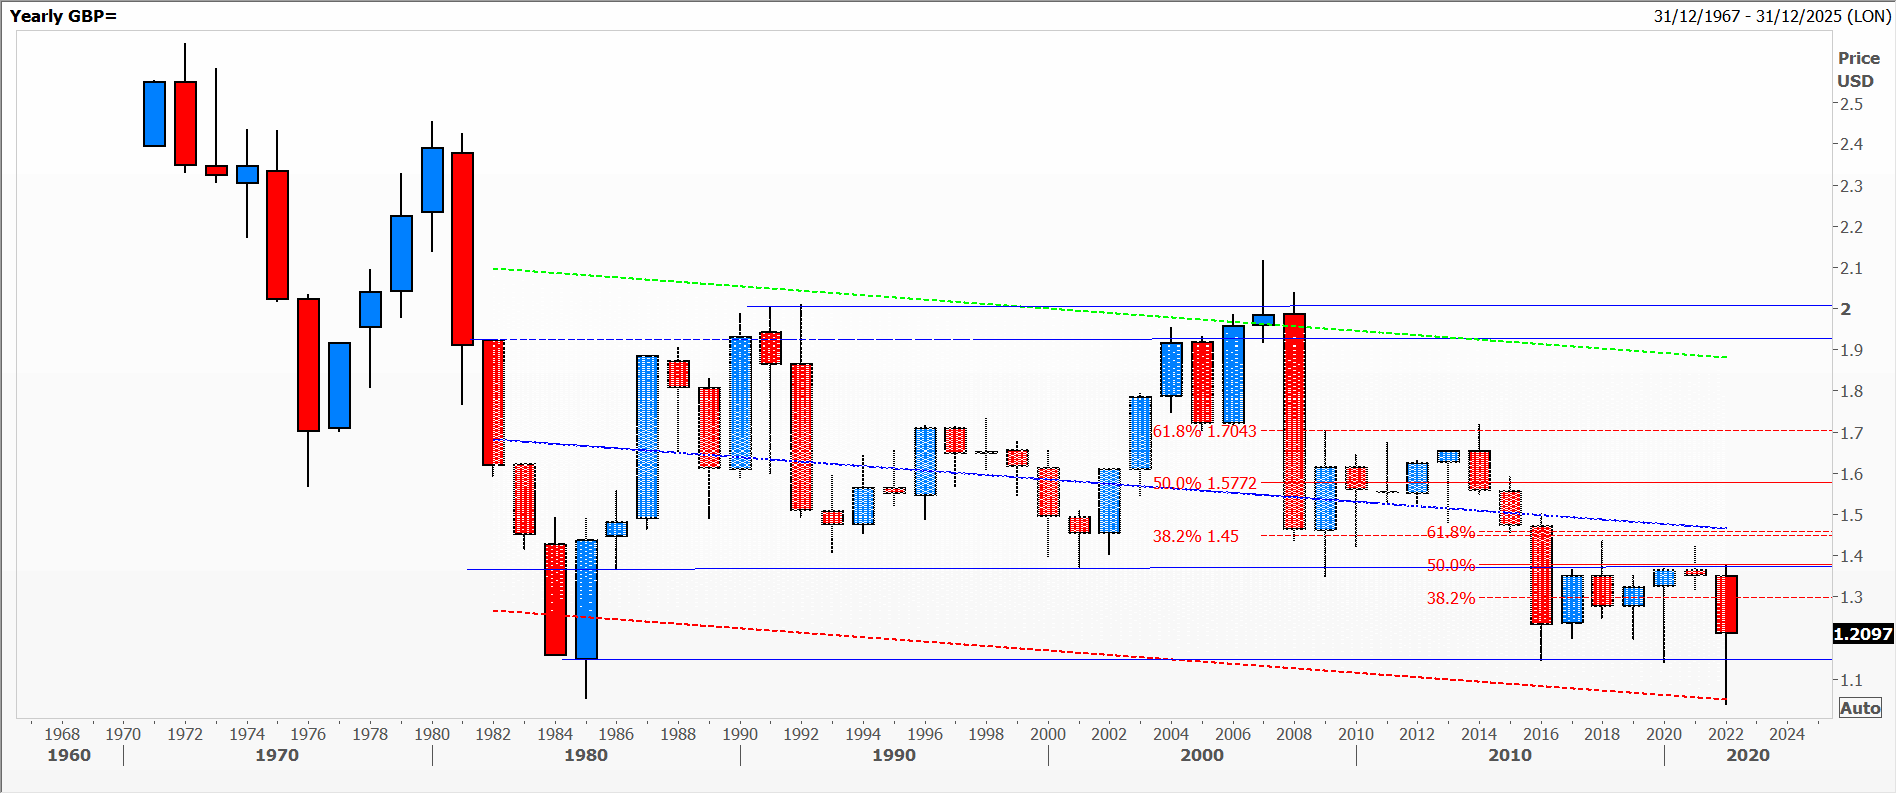
GBP
The US NASDAQ index, where vast amounts of money have been lost on the shares of the technology darlings. A whopping annual bearish engulfing candle giving up a Fibonacci 38.2% of the rally since 2008 and half of the explosive burst higher since 2018; note that current prices are well above the narrow channel that had dominated prior to that.
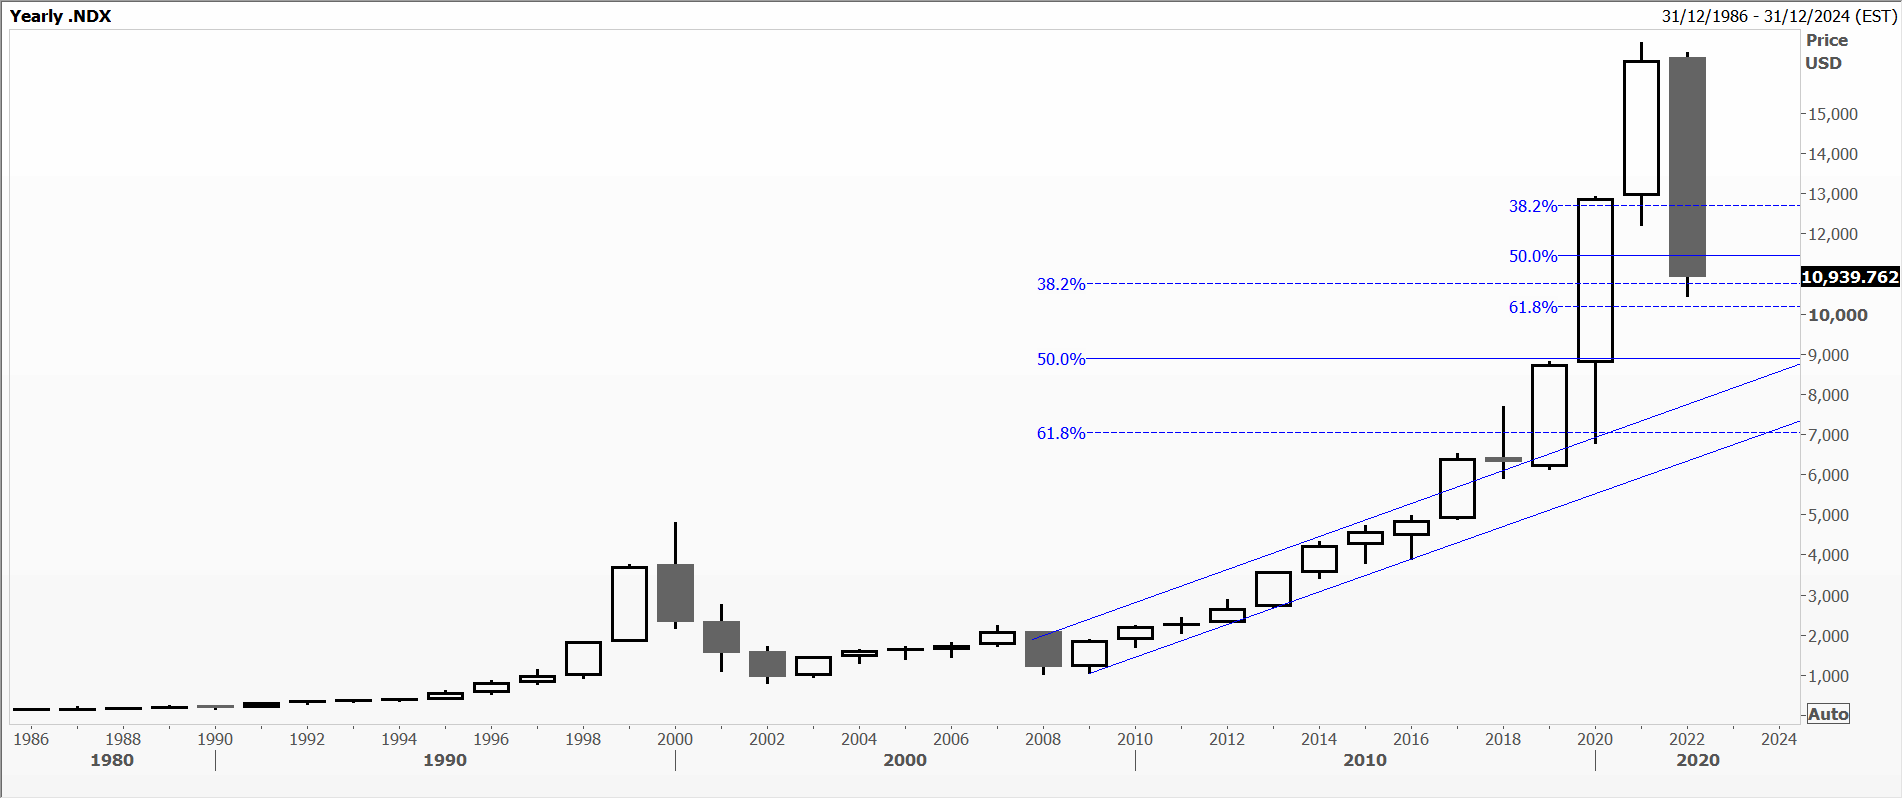
Nasdaq
My final chart is that of NYMEX crude oil, the internationally recognised benchmark, which displays a giant doji type candle; I’d call it an extreme shooting star. In a way it balances out the stupidity of 2020’s hammer low when we hit -$40 a barrel. The extreme spikes on both of these candles underline the fact that these levels are unsustainable – and that markets can be irrational.
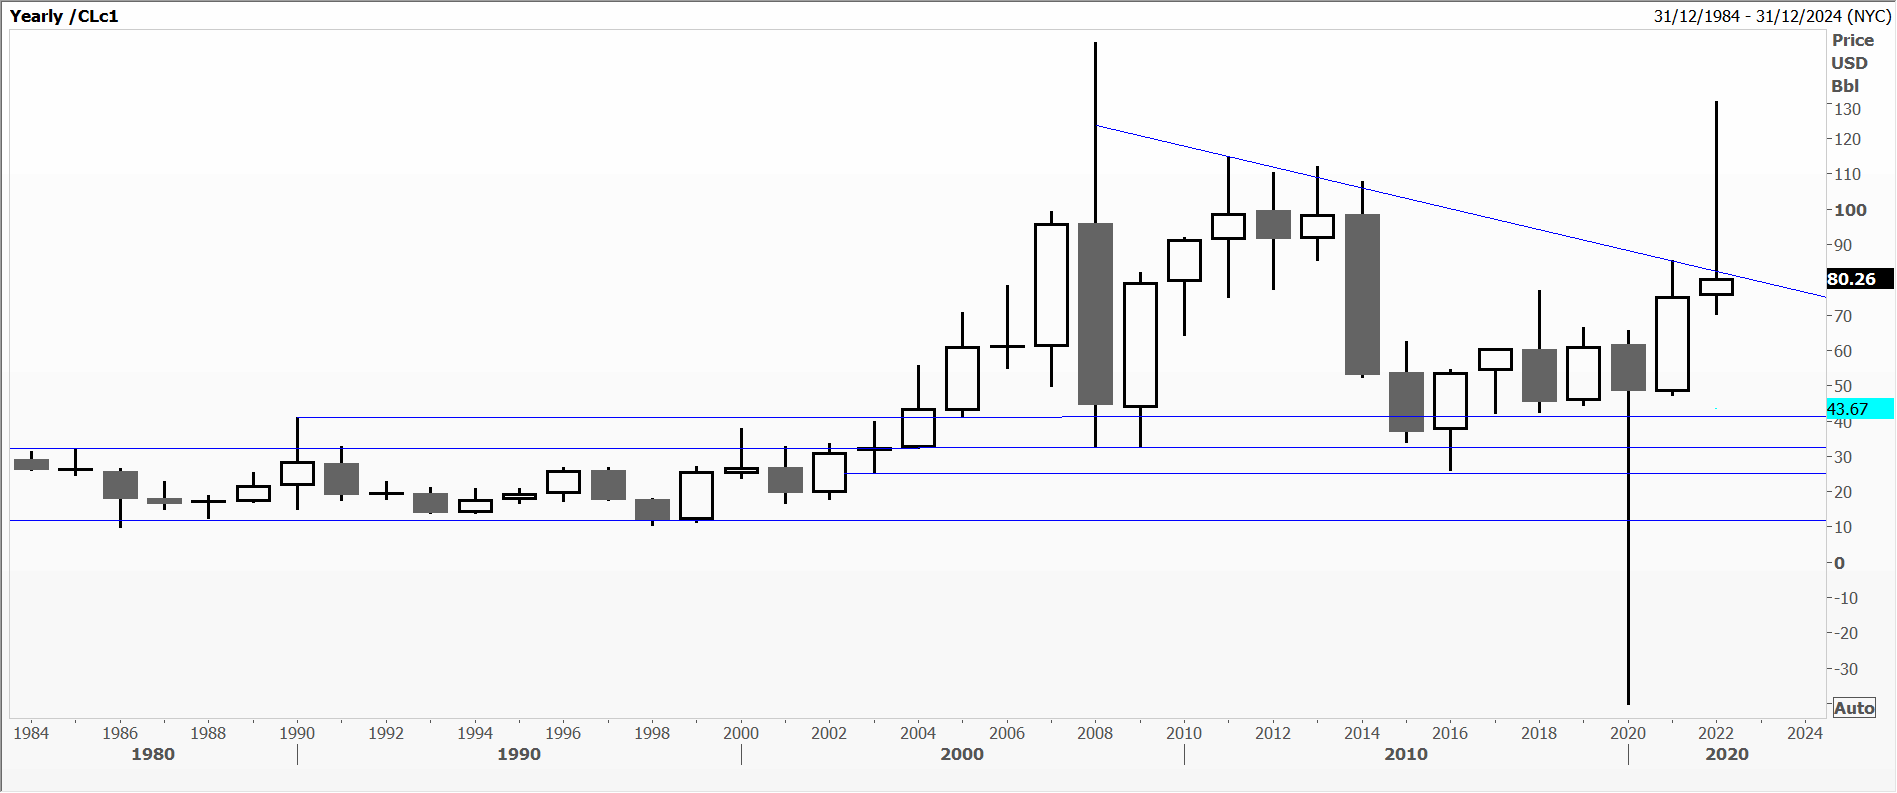
Crude
Tags: Annual charts, doji candle, violent reversals
The views and opinions expressed on the STA’s blog do not necessarily represent those of the Society of Technical Analysts (the “STA”), or of any officer, director or member of the STA. The STA makes no representations as to the accuracy, completeness, or reliability of any information on the blog or found by following any link on blog, and none of the STA, STA Administrative Services or any current or past executive board members are liable for any errors, omissions, or delays in this information or any losses, injuries, or damages arising from its display or use. None of the information on the STA’s blog constitutes investment advice.


Latest Comments