


‘That Was the Year that Was’ And a happy New Year to all STA members and followers
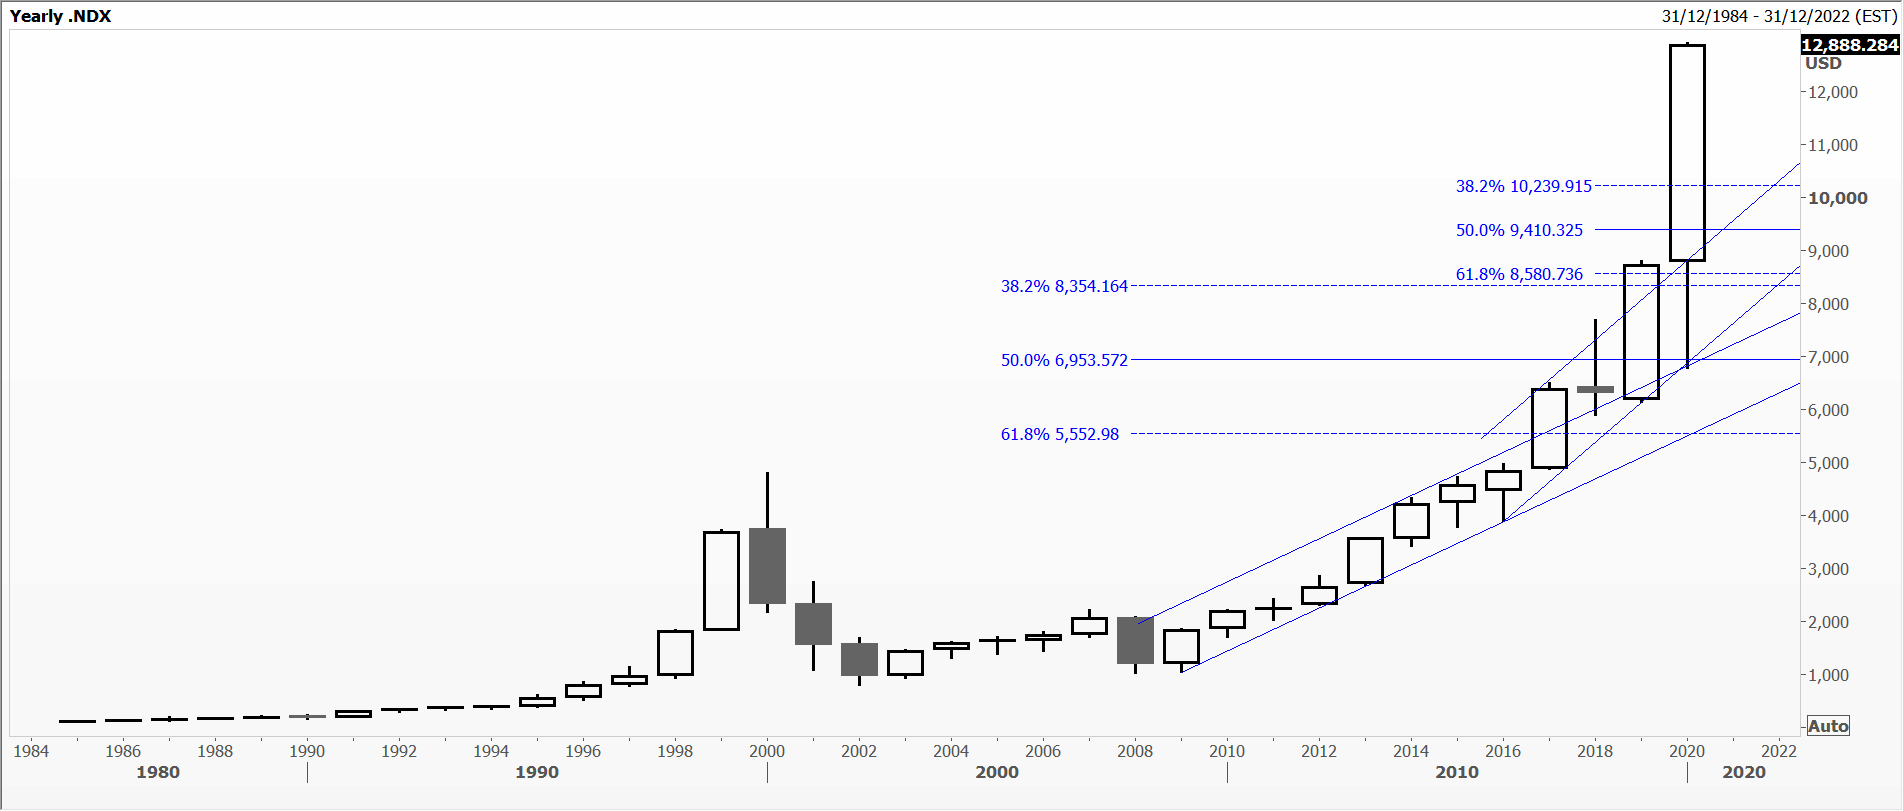
NASDAQ
An album of satirical songs recorded live by Tim Lehrer in 1965, and originally written for NBC’s TV series ‘That Was the Week that Was’, somehow it sums up the year of the pandemic. But that’s not what I’m thinking of today.
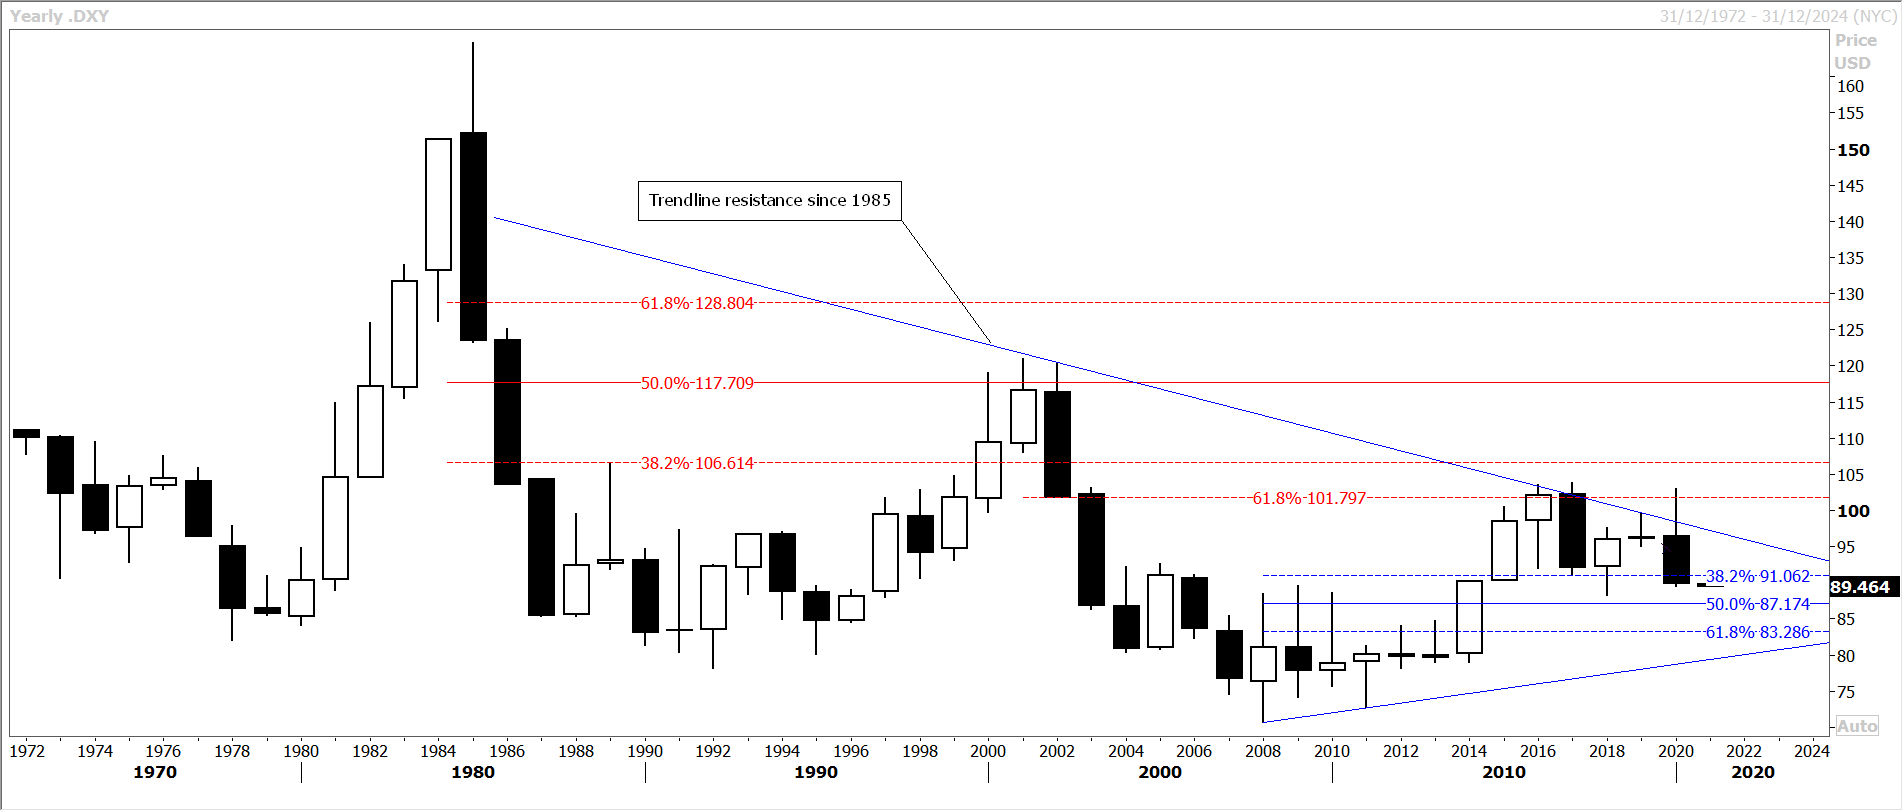
DXY
You see, there is really only one day in any year when it’s worth looking at a certain type of chart and, unfortunately, that’s January 1st – New Year’s Day. I looked at annual candlesticks, where each one contains all the price action since the first working day of the calendar year to the last one. In 2020 that was from Thursday the 2nd January to Thursday the 31st December.
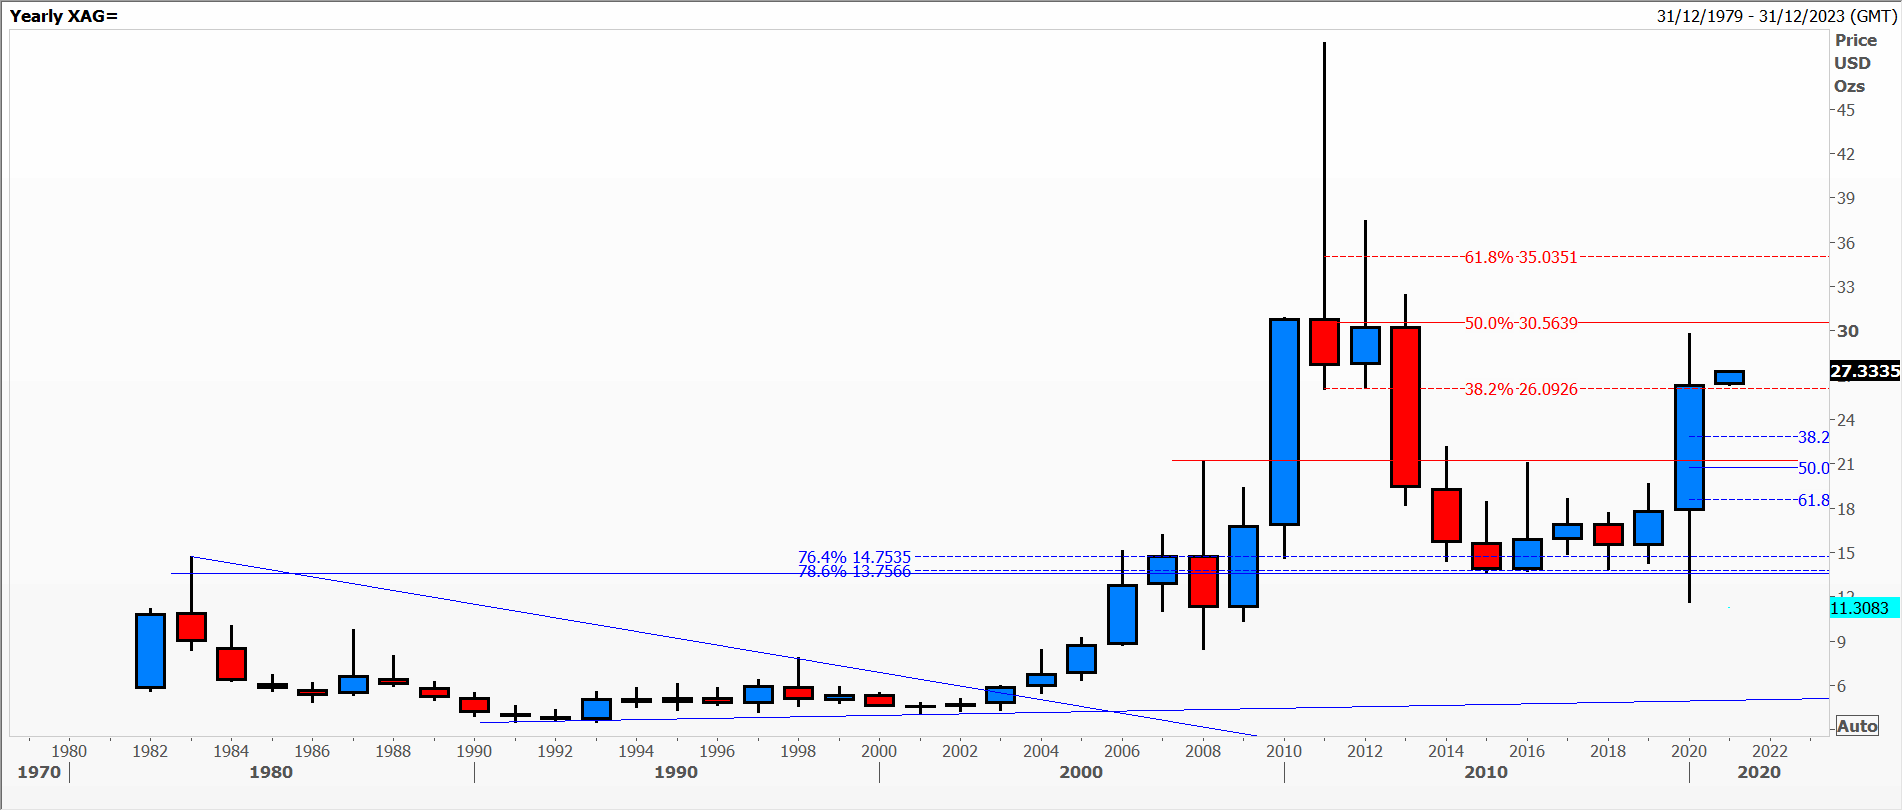
XAG
To help me filter for the most interesting charts of the hundreds I track, I start with what Reuters calls a ‘rebasing’ chart. All instruments start the year at a value of 100, then percentage gains and losses are plotted. No surprise that the US NASDAQ index was one of the best performers, but just look at the chart! By far the biggest ever annual range and up a hefty 45%. Interesting that spot silver was up 46%, ChiNext 44%, US soybeans 39%, South Korea’s KOSPI and Shenzhen A shares coming in at up 32% a piece.
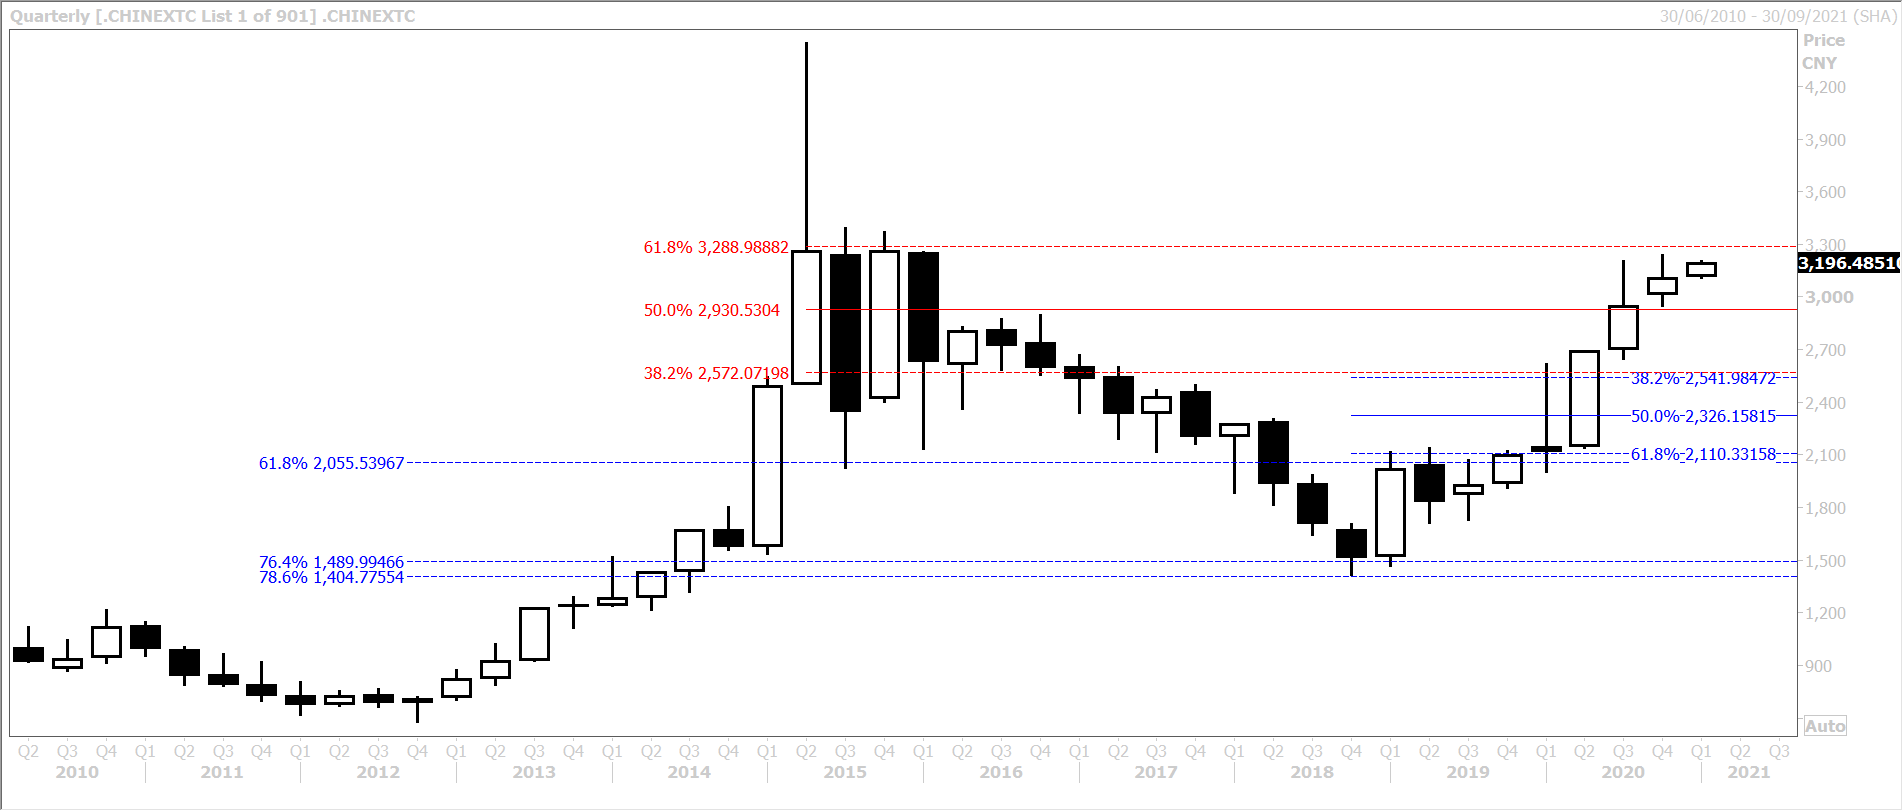
CHINEXT
Then I cluster the different instruments into candlestick types. A lot of stock indices have doji or hanging man shapes, where some are still struggling at the highs of the last 4 years (DAX), others at the highs of 22 years ago (FTSE 100) and off 14% in 2020. Other losers include Spain’s IBEX (-16%) and Italy’s MIB which has held in the same broad range since 2009.
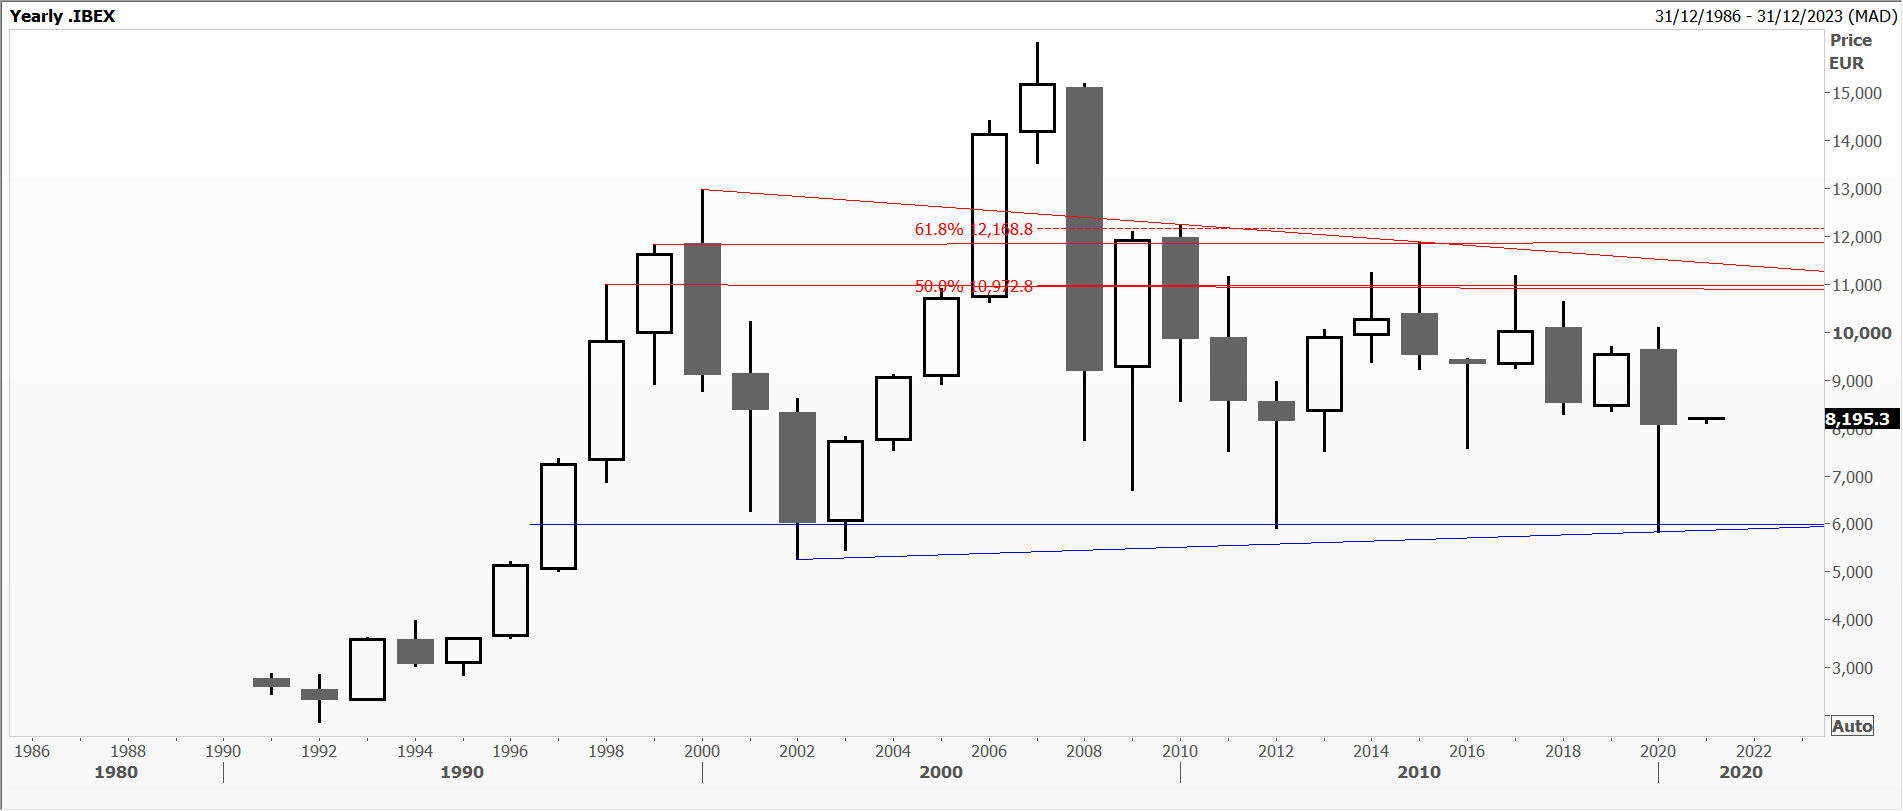
IBEX
In terms of the foreign exchange market the US dollar index was generally under pressure, losing 7% of its buying power and closing at its lowest level since 2013. Other losers were the Russian rouble
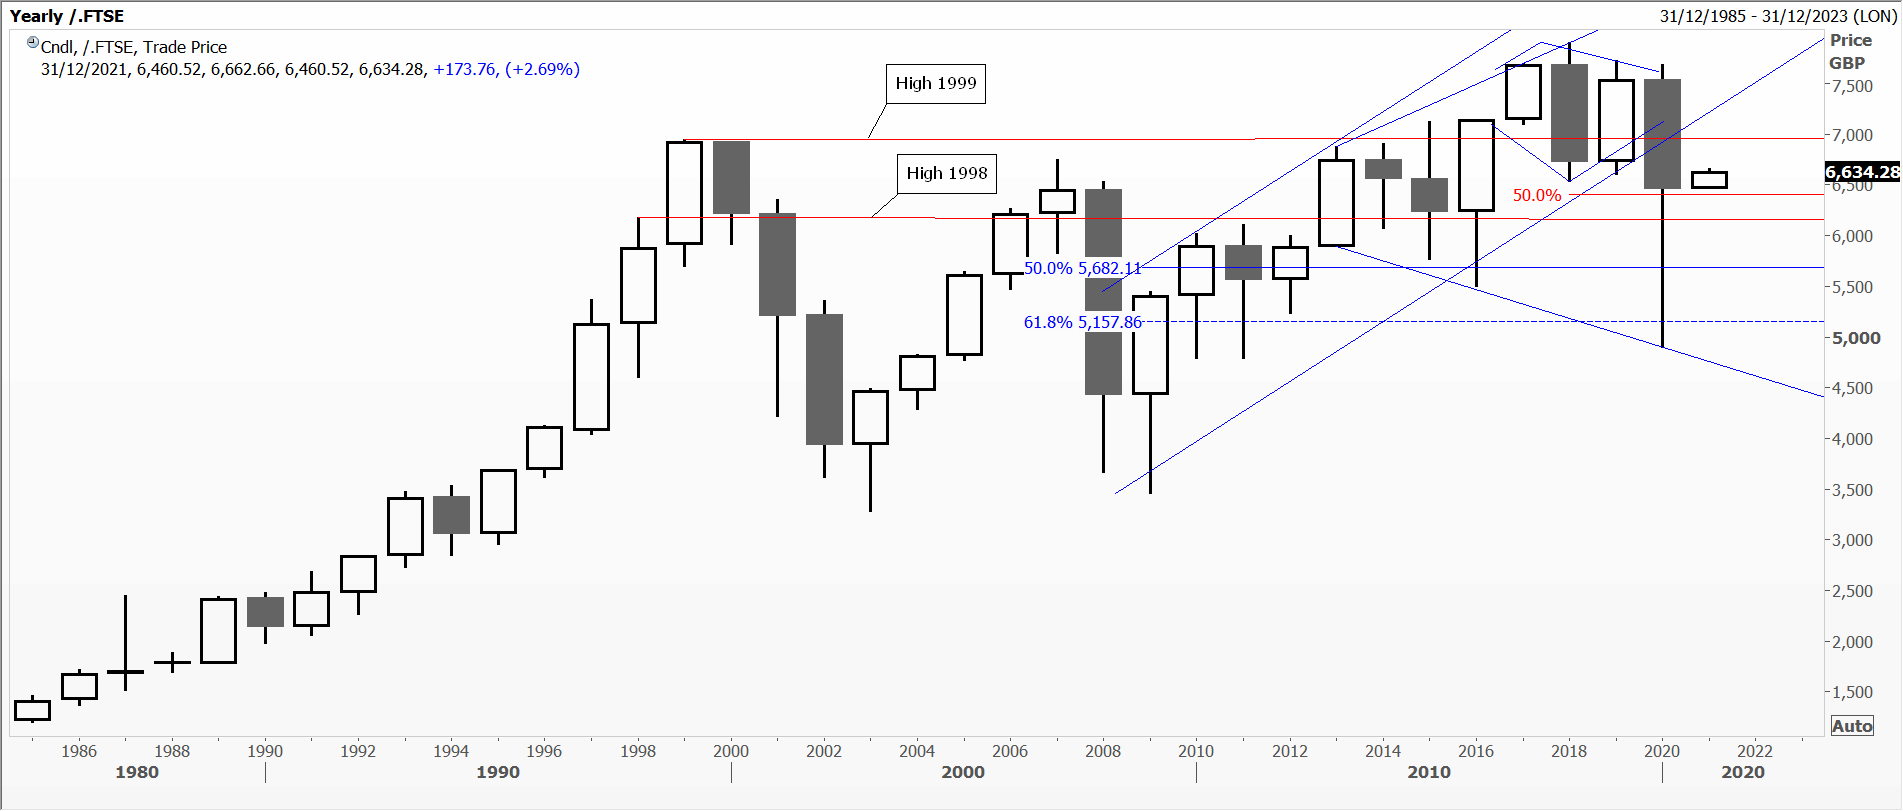
FTSE
(-19%), the Turkish lira (-25% – explaining Borsa Istanbul’s 27% rally), and the Brazilian real (-29%).
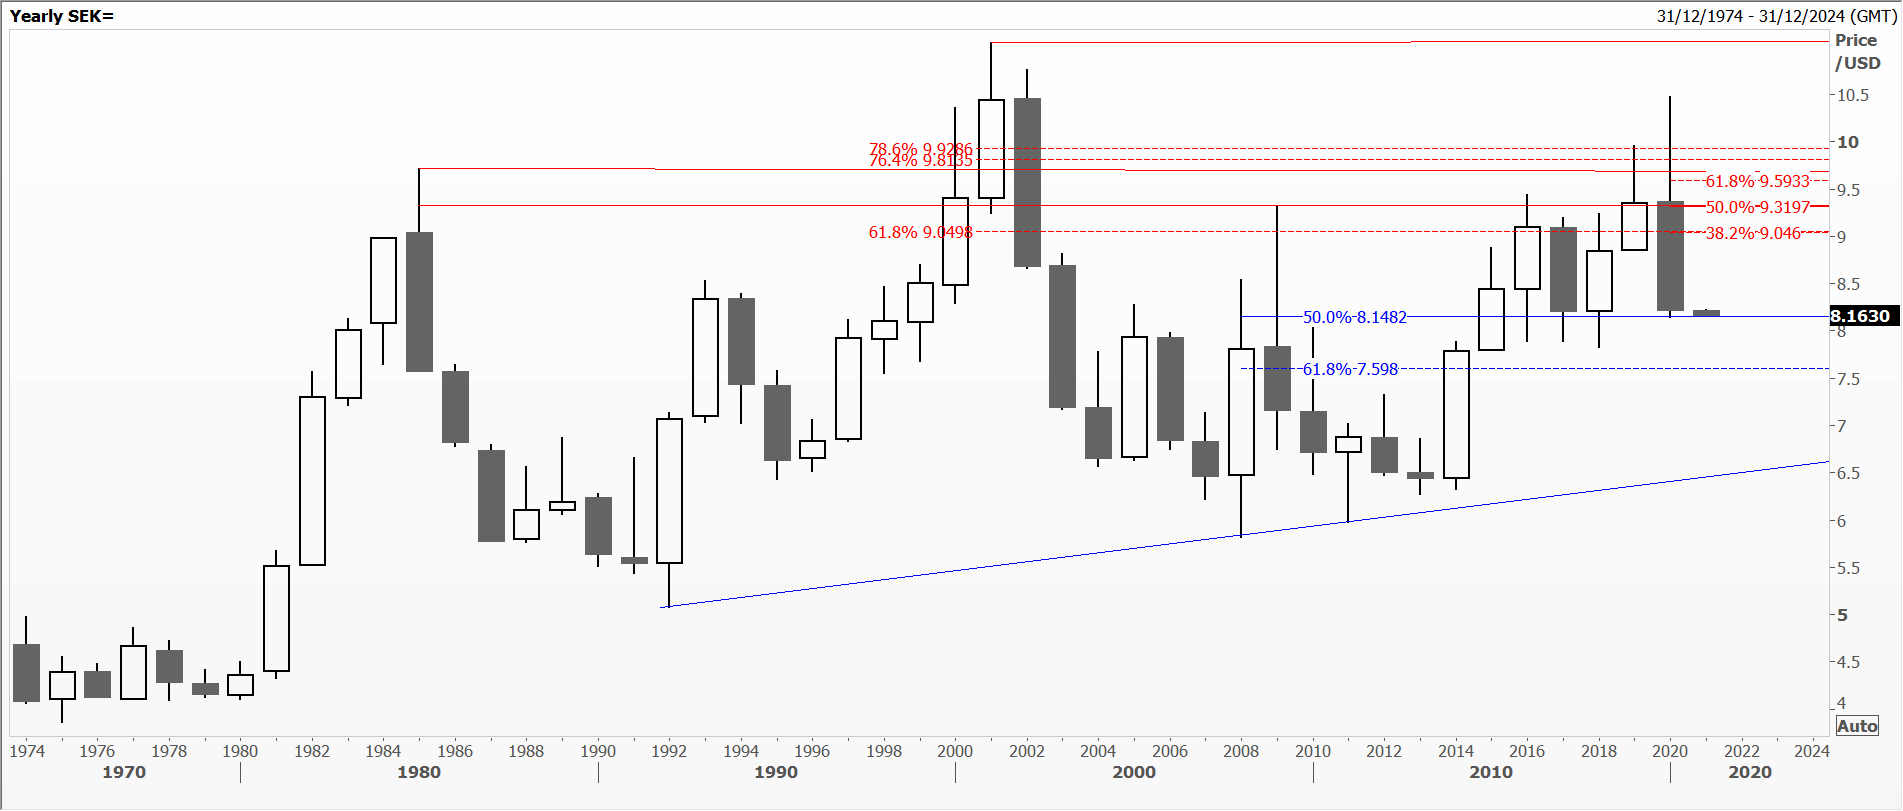
SEK
In terms of commodities, both gold and high grade copper added 24% to their price in US dollars, oilseeds and grains adding as follows: oats +21%, corn +23%, rapeseed +34% and soybeans +39%. Interestingly the gains for the last four were concentrated in the fourth quarter of the year.
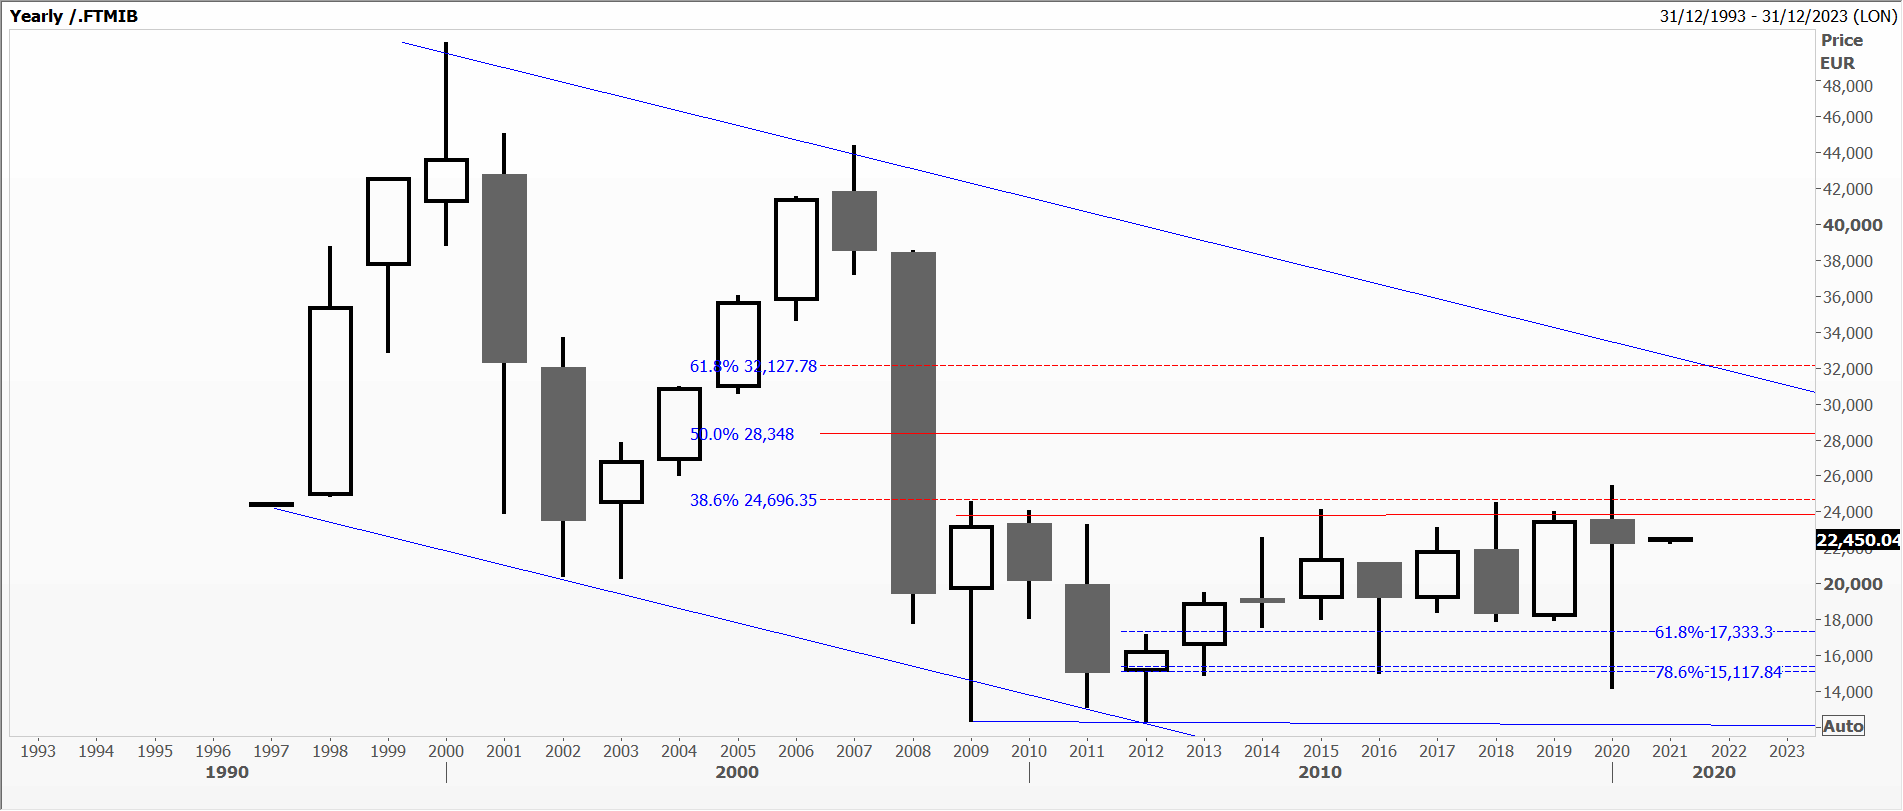
MIB
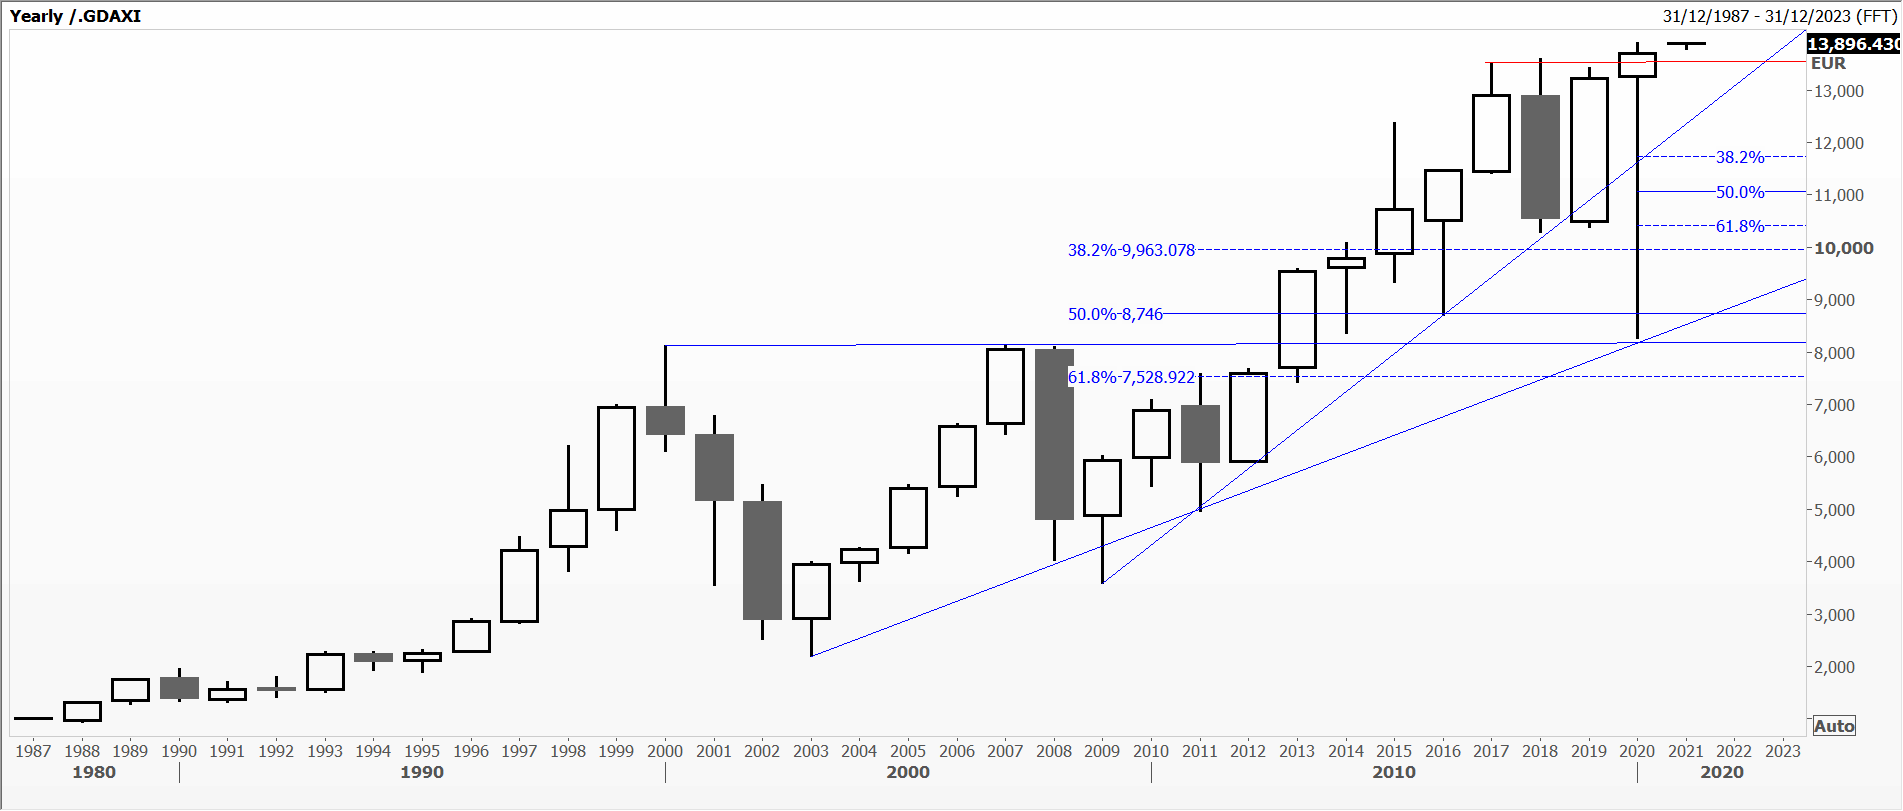
DAX
Tags: candles, long term view, percentages
The views and opinions expressed on the STA’s blog do not necessarily represent those of the Society of Technical Analysts (the “STA”), or of any officer, director or member of the STA. The STA makes no representations as to the accuracy, completeness, or reliability of any information on the blog or found by following any link on blog, and none of the STA, STA Administrative Services or any current or past executive board members are liable for any errors, omissions, or delays in this information or any losses, injuries, or damages arising from its display or use. None of the information on the STA’s blog constitutes investment advice.


Latest Comments