Technical Analysts Tackle Volatility: Economists Fiddle with Percentages
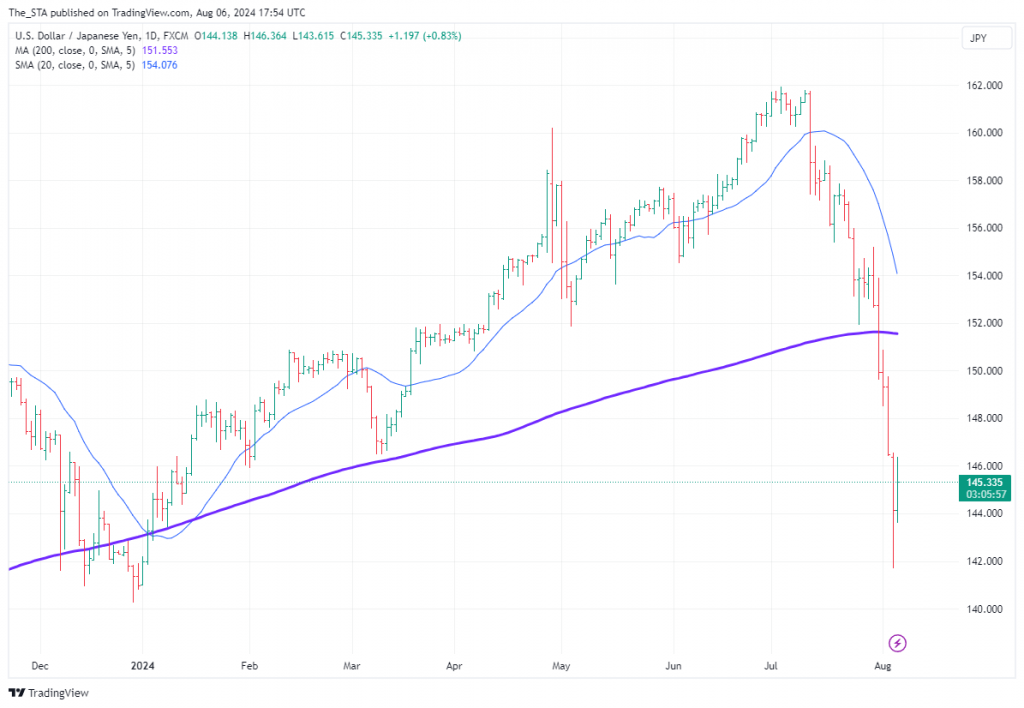
So far this summer markets have had a fairly torrid time, some stock indices setting new all-time highs in July, then peaking without warning and dropping by fairly large amounts over the last three or four weeks. Overlaid on this were interest rate moves by a select few central banks, and sharp revisions in the value of the Japanese yen. Nearly all financial media outlets reported these as percentage moves – usually breathlessly.
As you can already see in the paragraph above, there is much vocabulary which is relative, is an abstract amount, or cannot be compared to earlier prices in the data series. When dropping from a record high, point moves are likely to be much bigger than when rallying from a significant low. Central bankers are regularly ridiculed for being ‘behind the curve’ and when currencies are exceptionally weak and suddenly get caught in the headlights, they react fast.
Both implied and historical volatility are a relative thing depending on the market, liquidity and even the time of day. As the saying goes, when the thundering herd is on the move, the fire exits become very small.
Was there really no warning about what might have been around the corner? An optimist will agree. A technical analyst will be constantly monitoring the size of daily and weekly price moves, volume and implied volatility if available, and other oscillators they favour.
Moving averages, trend lines and other smoothing tools are used by many and act as a gauge of momentum in the instrument. This is perhaps at its most obvious in Ichimoku Cloud charts where these supply a series of support and resistance levels for today and looking ahead into the future.
And let’s not forget the famous chart patterns whose names even the uninitiated know of, like head-and-shoulders, cup-and-saucer and the kids’ favourite: rounded bottom.
As a seasoned (and some say cynical) market veteran I tend to ignore most screaming headlines. Nevertheless even I was shocked when I heard that US computer stalwart Intel managed to lose 28 per cent of its share value intra-day on Friday the 2nd August 2024.
Tags: market moves, structure, tactics, volatility
The views and opinions expressed on the STA’s blog do not necessarily represent those of the Society of Technical Analysts (the “STA”), or of any officer, director or member of the STA. The STA makes no representations as to the accuracy, completeness, or reliability of any information on the blog or found by following any link on blog, and none of the STA, STA Administrative Services or any current or past executive board members are liable for any errors, omissions, or delays in this information or any losses, injuries, or damages arising from its display or use. None of the information on the STA’s blog constitutes investment advice.
Latest Posts
- Why Your Post-Nominals Matter: MSTA & FTSA July 3, 2025
- How I Used Dow Theory to Strengthen My Market Convictions June 20, 2025
- The New Monetary Order: Russell Napier on Inflation, Debt, and Financial Repression June 12, 2025
- Why I Became (and remain) a Member of the STA May 29, 2025
- The Emotional Rollercoaster of Markets: Why Bubbles Repeat and How to Outsmart Them: Summary of Kim Cramer Larsson talk May 14, 2025


Latest Comments