


Putting doji candlesticks into practice: Recent real-life examples
On the 19th of July Jeremy Naylor’s guest on Charting the Markets for IG TV was Patricia Elbaz, independent technical analyst and university lecturer. She gave an excellent introduction to the basics of candlestick charts: how they are constructed, the importance of the bodies relative to their shadows, what happens when the open and close are at the same level. You can view the session in the blog section of our web site: www.technicalanalysts.com
After explaining how candles are constructed, she moves on to one-candle patterns; the first slide shows four different Doji. Compared to her, I think I’m a bit sloppy on the subject and operate with a lot more leeway. I’d forgotten their proper names, I’m not too fussed if the open and closing levels are not identical – just so long as the body is quite small, that’ll do for one of my Doji.
Then, at the beginning of August I looked at monthly candle charts of a host of different instruments. I do this every month, four times a year with quarterly candles, and use yearly ones in January. It’s a good habit to get into and gives a better sense of perspective – a sort of stand back and let’s see.
Quite by chance many had monthly Doji candles! So, I went back to Patricia’s video and wrote down the names of the ones she had spoken about: Star, Hanging Man, Gravestone and Long-legged. I’ve picked out 5 good charts which happen to be well-known indices.
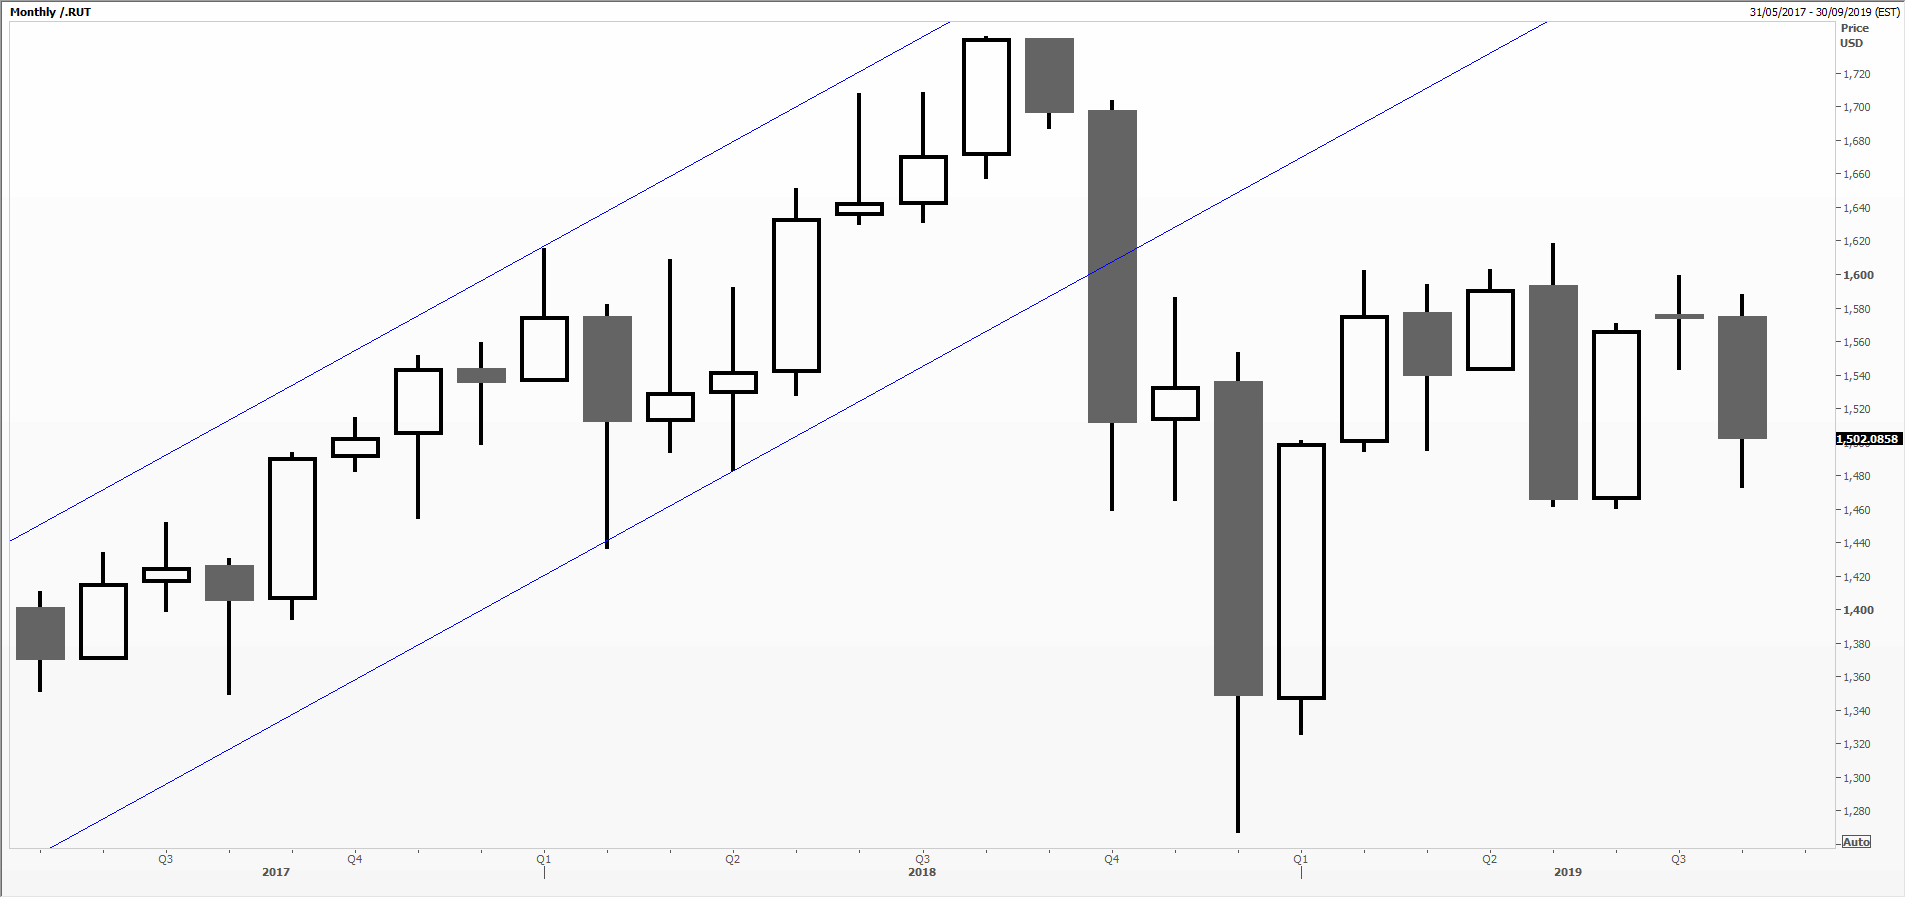
The US Russell index has a perfect Doji star in July at the 1600 area, horizontal resistance which has capped since February.
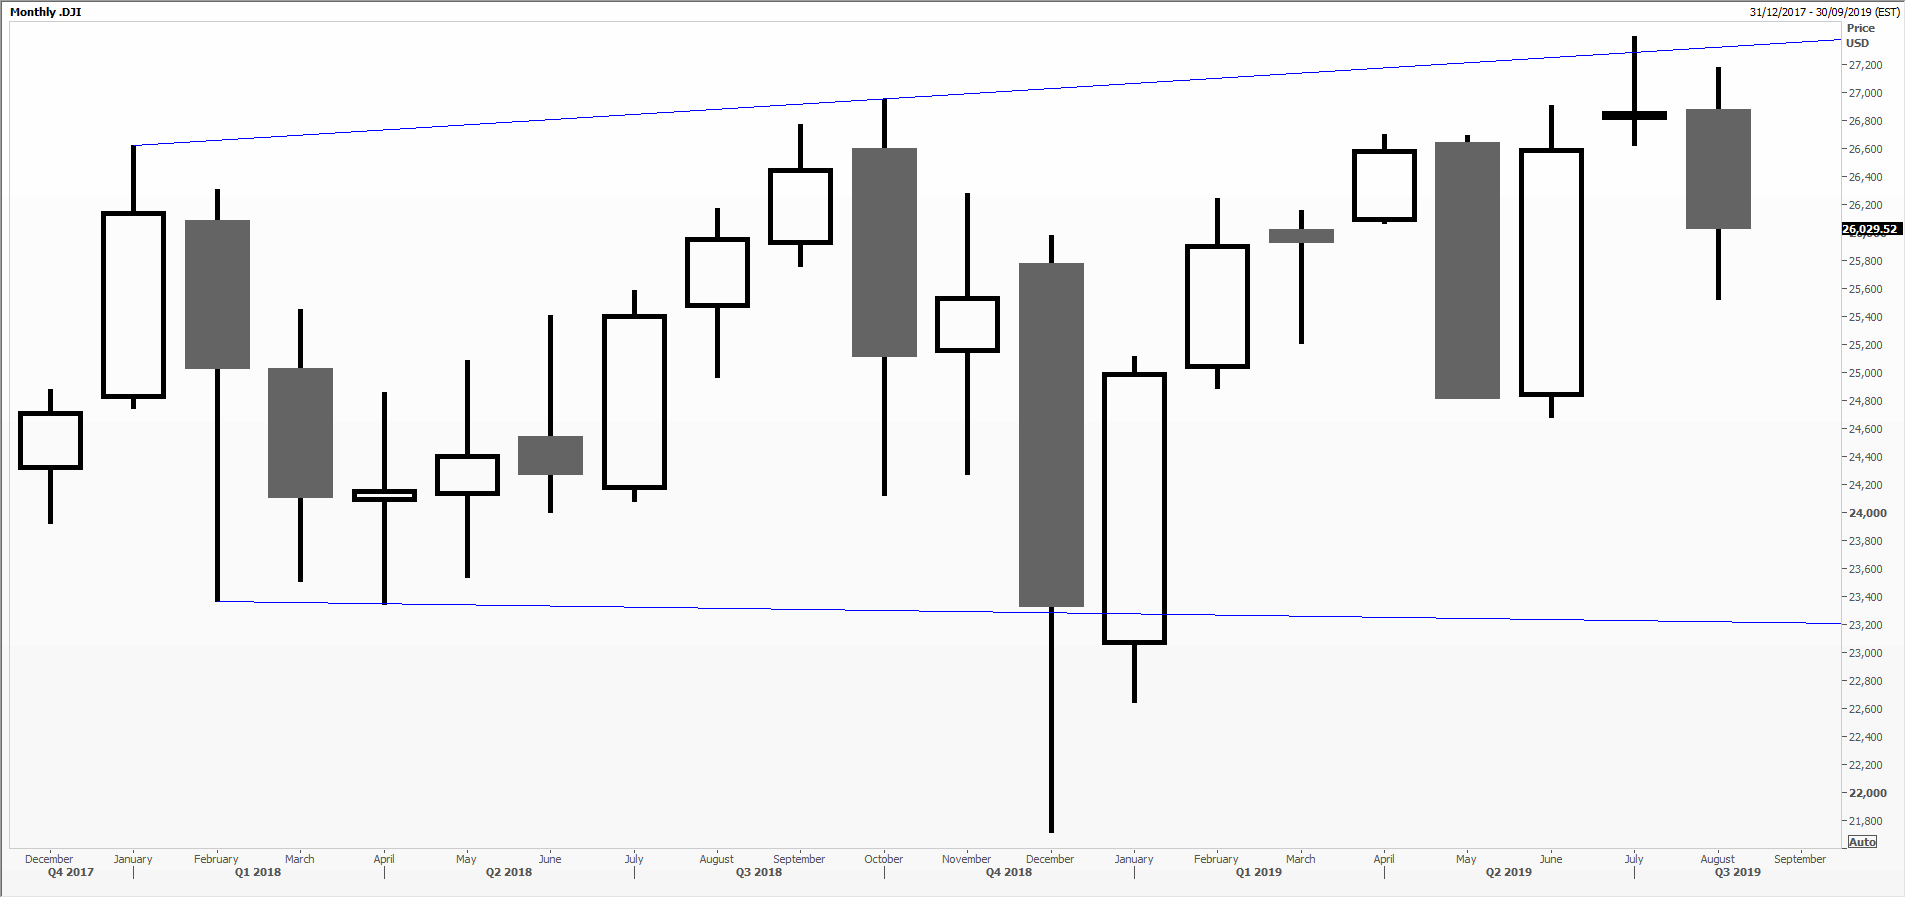
The Dow Jones Industrial Average has a perfect Gravestone Doji at the record high, at the upper edge of what might be a broadening top.
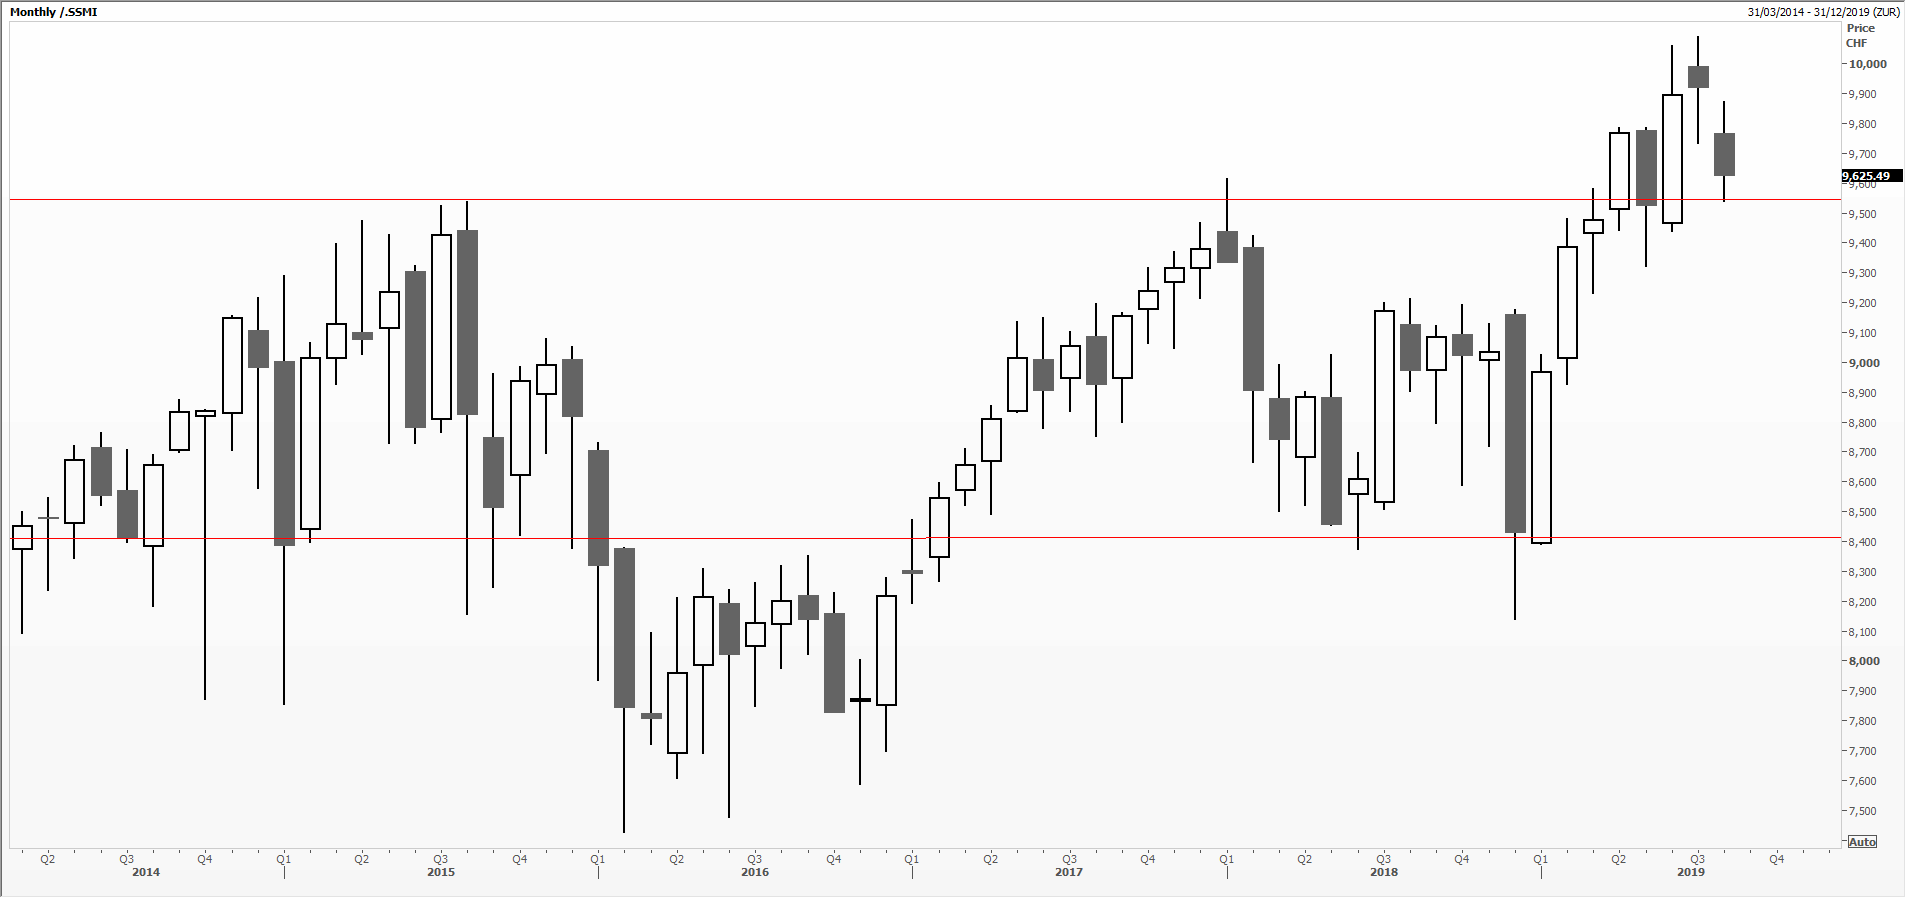
The Swiss Market Index has a Long-legged Doji which has a tiny body; maybe we’d call it a version of a Hanging Man candle.
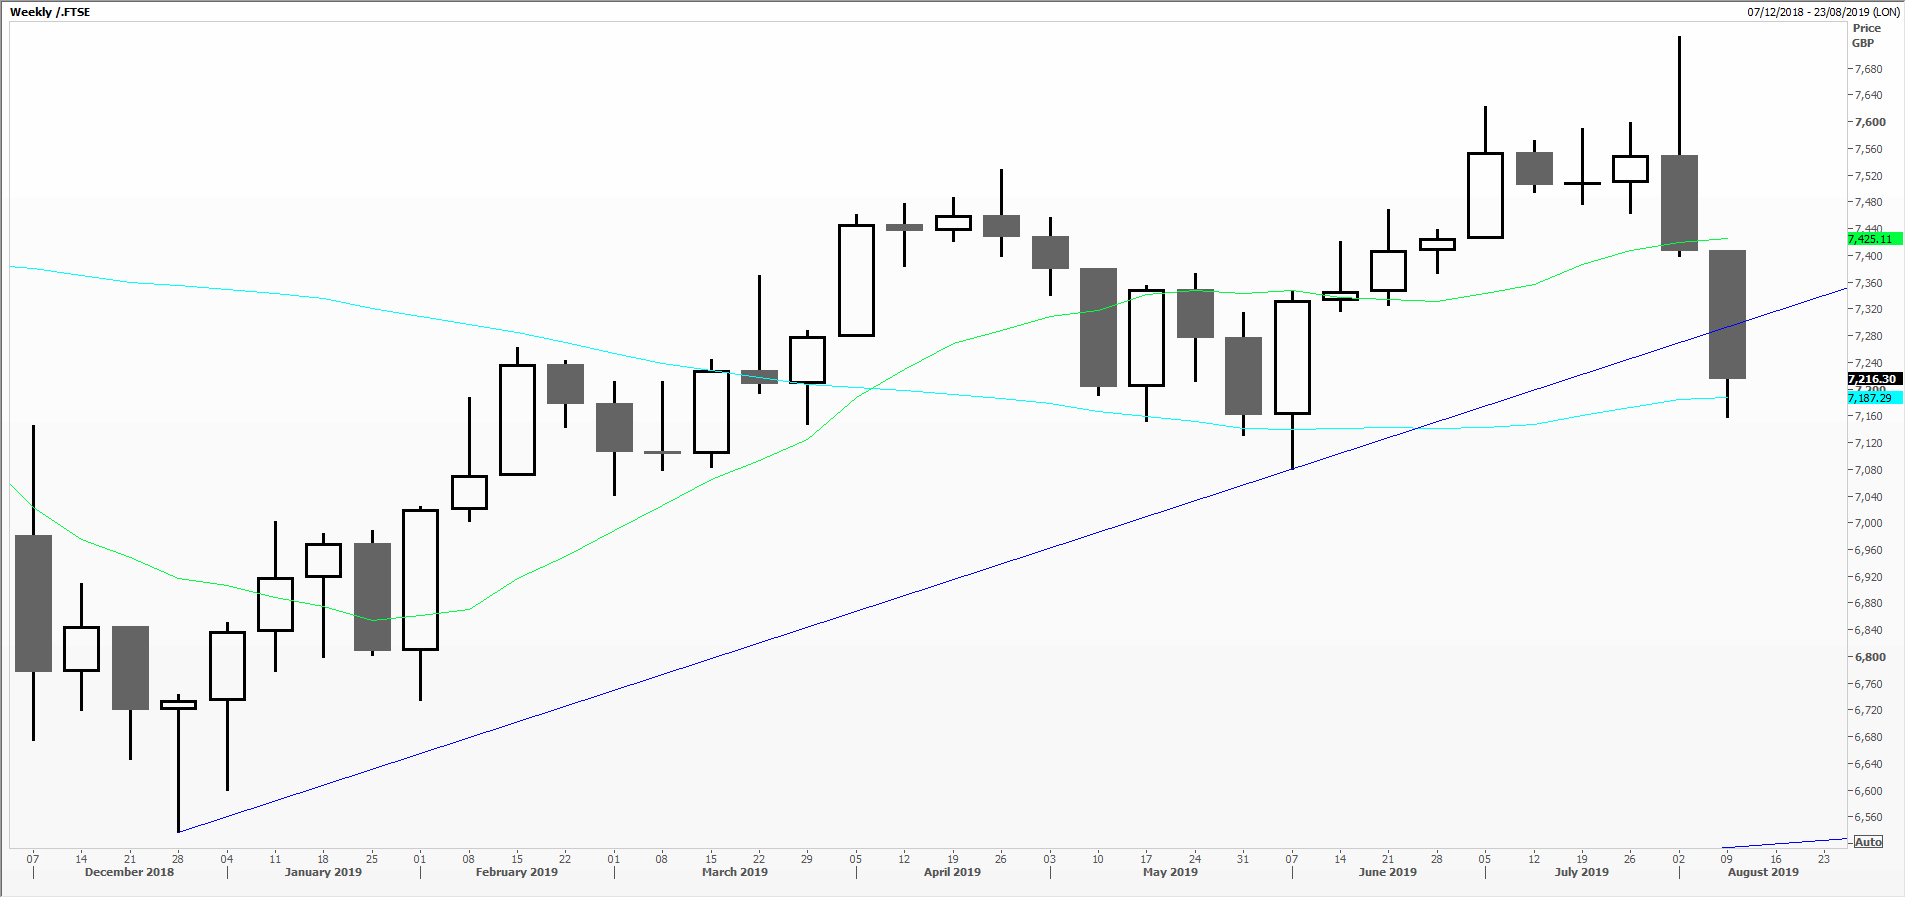
UK’s FTSE 100 has a big Shooting Star and false break in July following May’s Gravestone Doji.
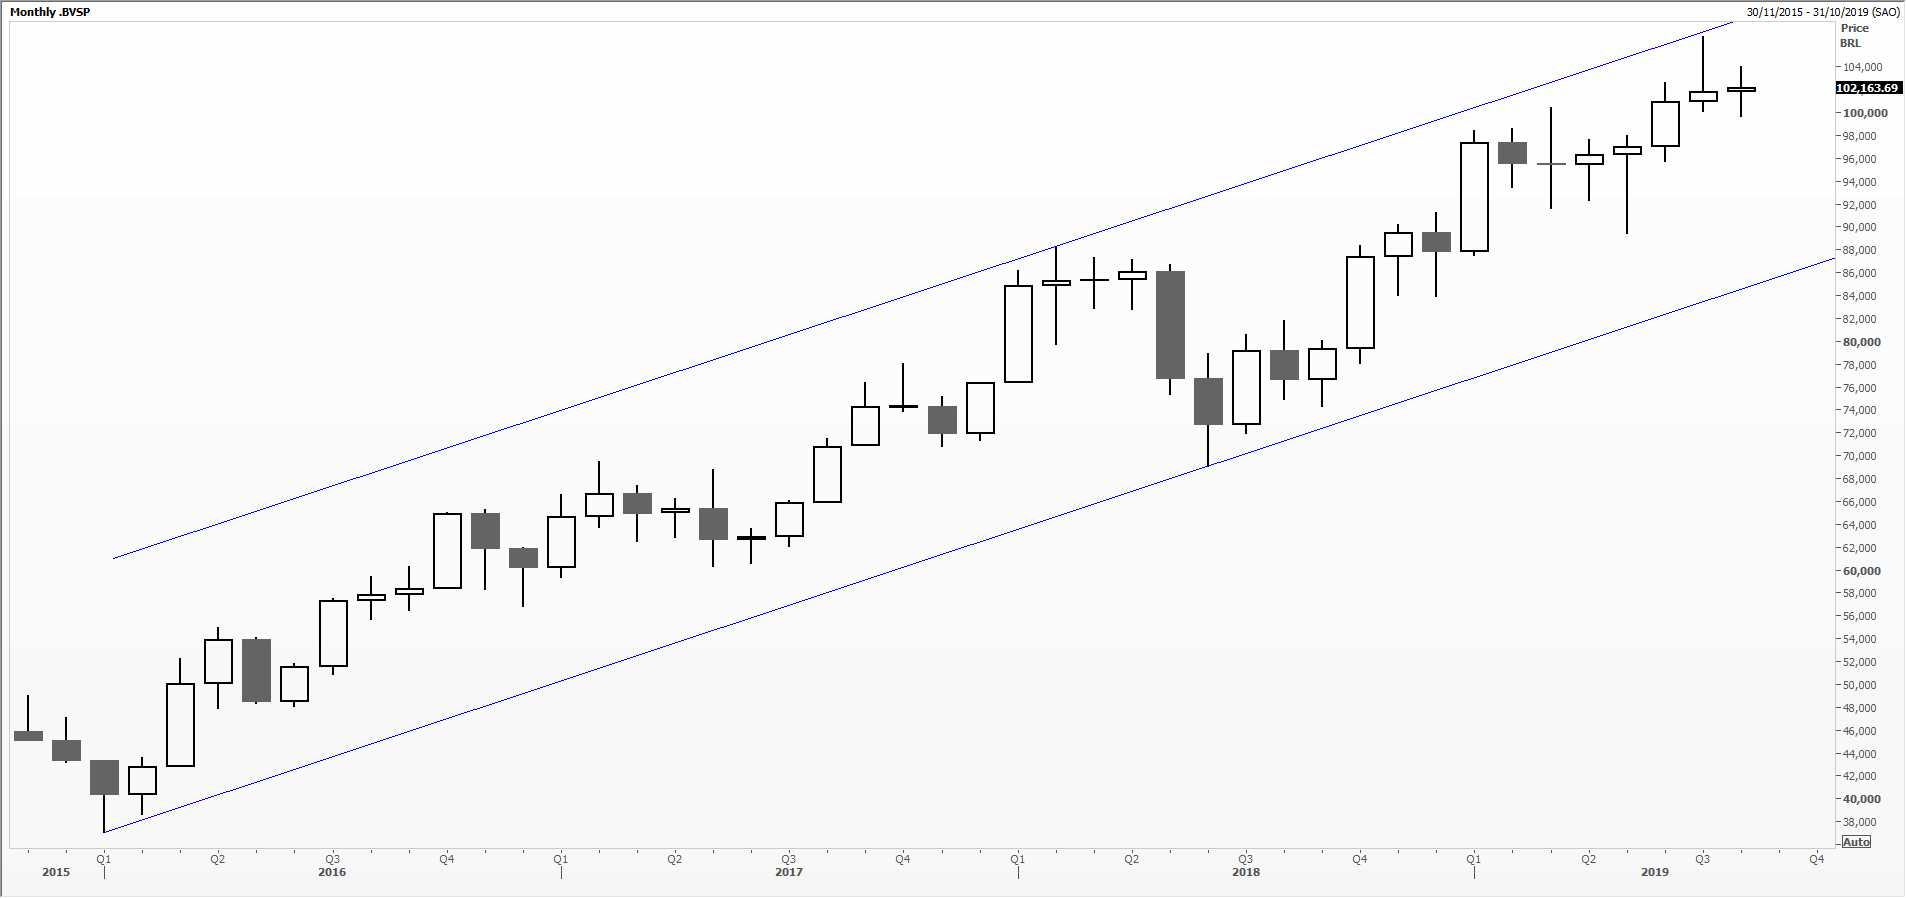
Finally, with Brazil’s Bovespa we work backwards from July’s Gravestone Doji at the record high after a strong 3.5-year rally. May was a Hanging Man, April too, and March a perfect Long-legged one.
You see, proper candles aren’t only found on slides and in textbooks.
The views and opinions expressed on the STA’s blog do not necessarily represent those of the Society of Technical Analysts (the “STA”), or of any officer, director or member of the STA. The STA makes no representations as to the accuracy, completeness, or reliability of any information on the blog or found by following any link on blog, and none of the STA, STA Administrative Services or any current or past executive board members are liable for any errors, omissions, or delays in this information or any losses, injuries, or damages arising from its display or use. None of the information on the STA’s blog constitutes investment advice.


Latest Comments