


Market reaction to EU July Industrial Production
Released Wednesday 15th September 09:00 GMT
Covid-19 caused the biggest global economic slump In at least a generation, if not a century. It’s no wonder that all too many – economists, politicians and the general public – are searching for small signs of improvement and the hope of better prospects. This week’s figures from the Eurozone did not disappoint.
In the month to the 31st July 2021 industrial production grew by 1.5 per cent, against consensus expectations of 0.6 per cent growth and compared to a 0.1 per cent decline in June. Annualised – a dangerous game as we compare data from last year’s deepest lockdown – this was growth of 7.7 per cent (6.6 per cent expected) and June’s 10.1 per cent. All well and good but in a global context let’s not forget slower growth in China this year, inflation in the USA and some OECD countries dipping from this summer’s peak, and elections looming in Germany.
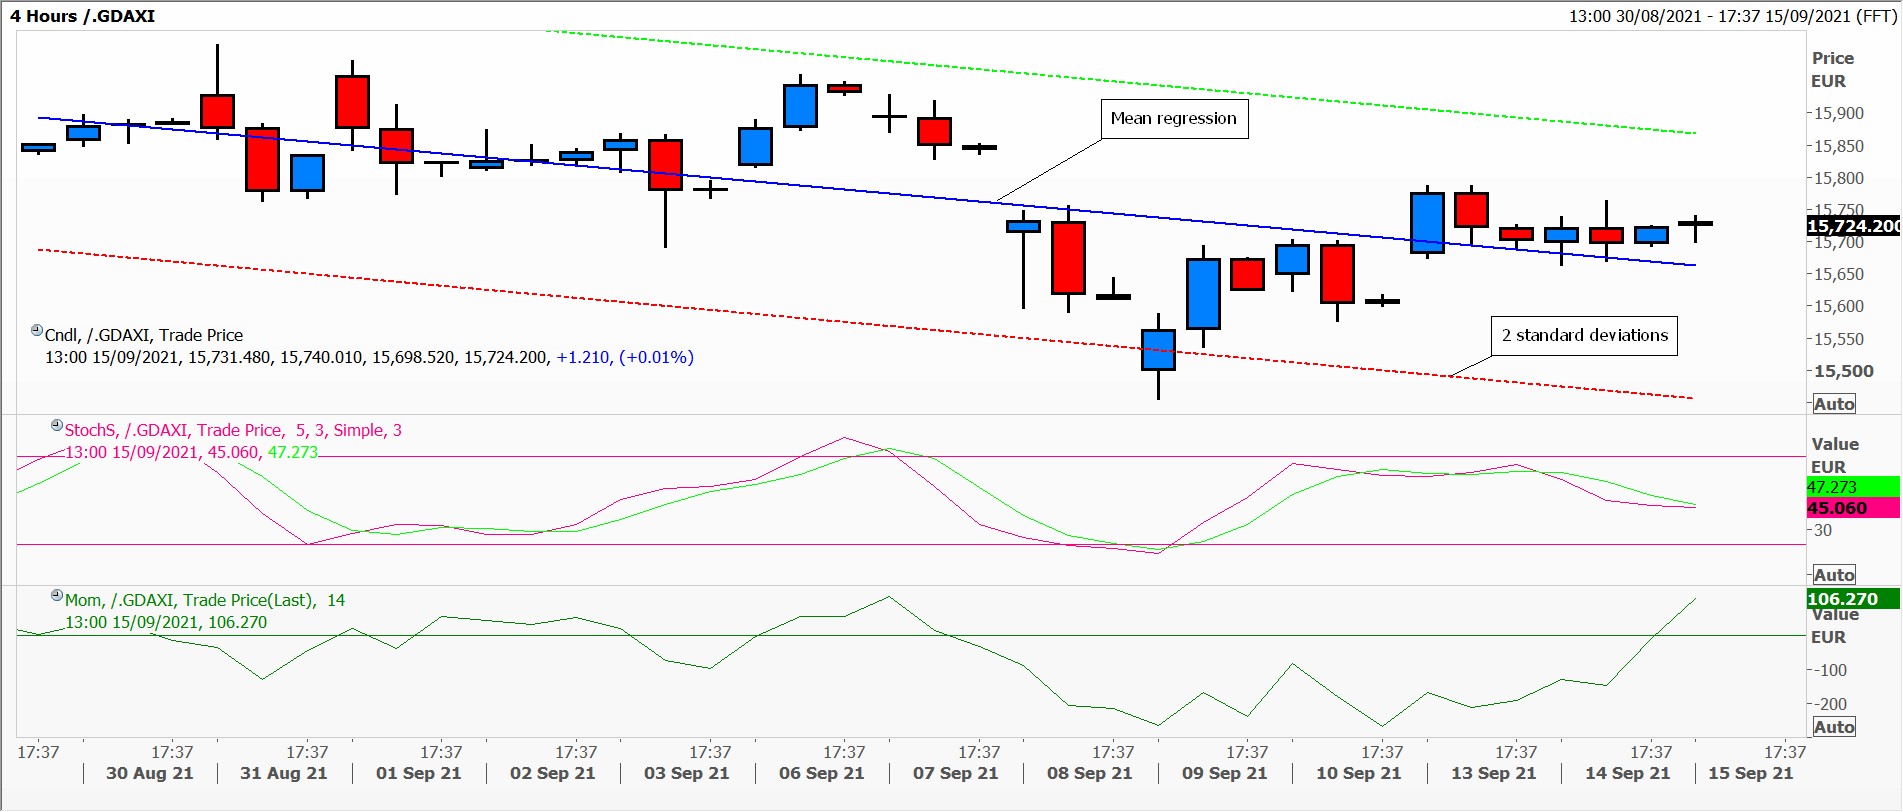 The first chart is a 4-hourly of Germany’s DAX stock market index. The time along the bottom is Frankfurt, one hour ahead of UK summer time, itself one hour ahead of GMT. It’s trading just under the record high 16,030 set mid-August. The index is in the process of being extended to 40 from the current 30 companies, and still will not represent the engine of the German economy which are the mittelstand companies. Hugging the gently downward-sloping mean regression, well within two standard deviations, momentum is no longer bearish and the slow stochastic neutral. As has been the case for many markets this year, volatility is very low, something that has been a problem for trading firms and spread betters.
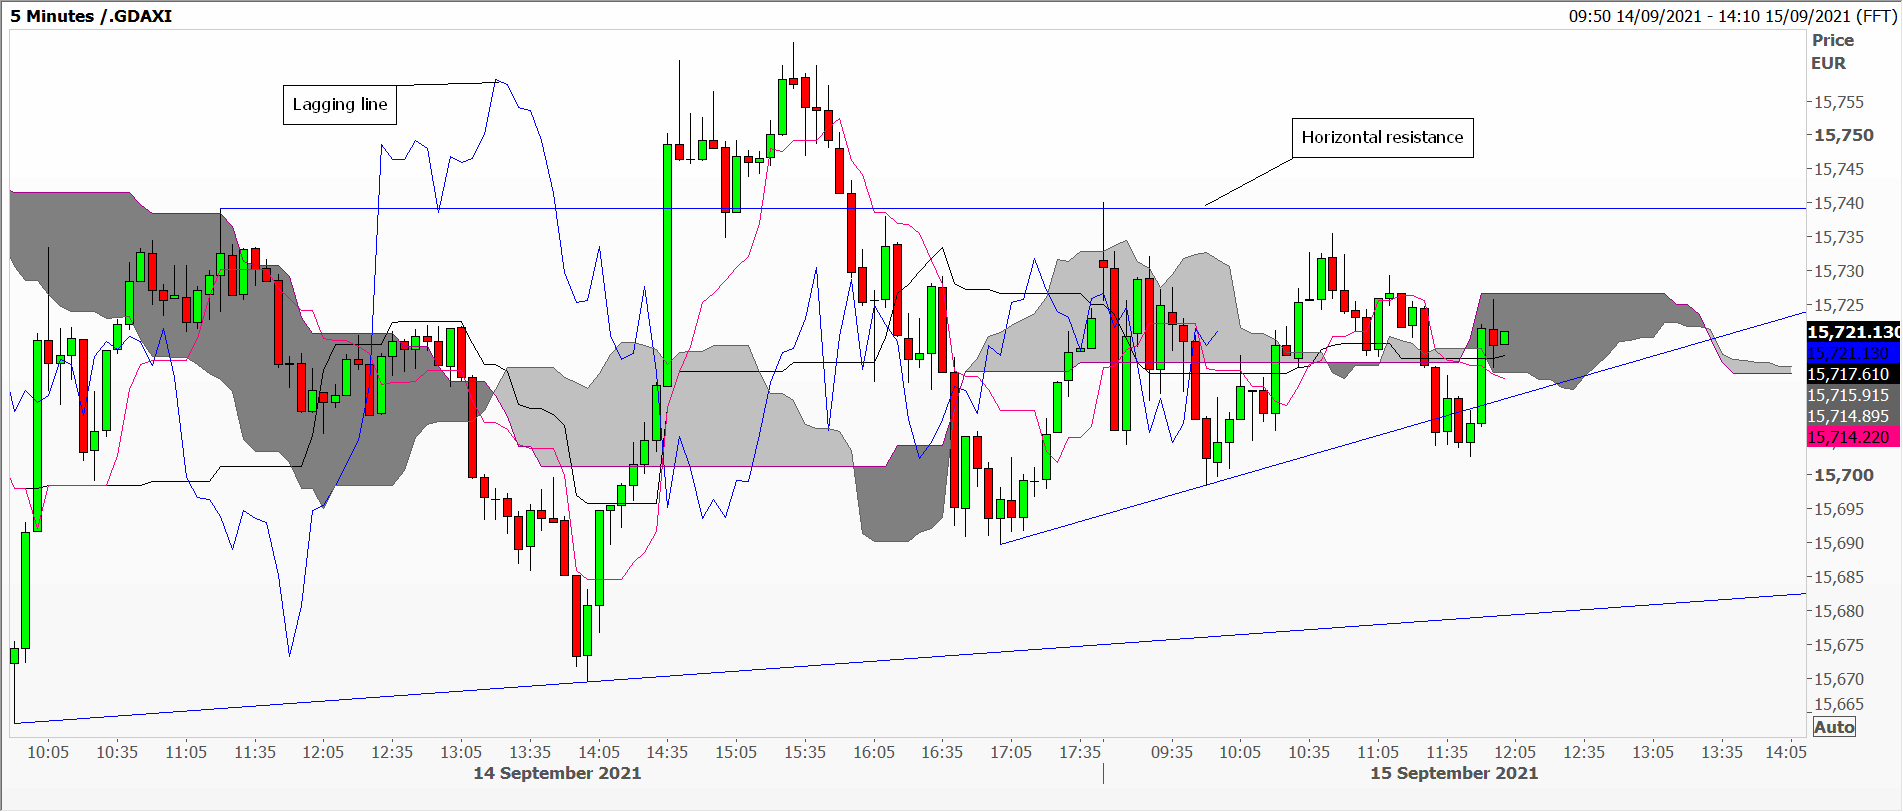
The 5-minute chart shows price action in the hour following the data release hovering around a central value at 15,700, where it had been most of the time the day before and the morning ahead of July’s data.
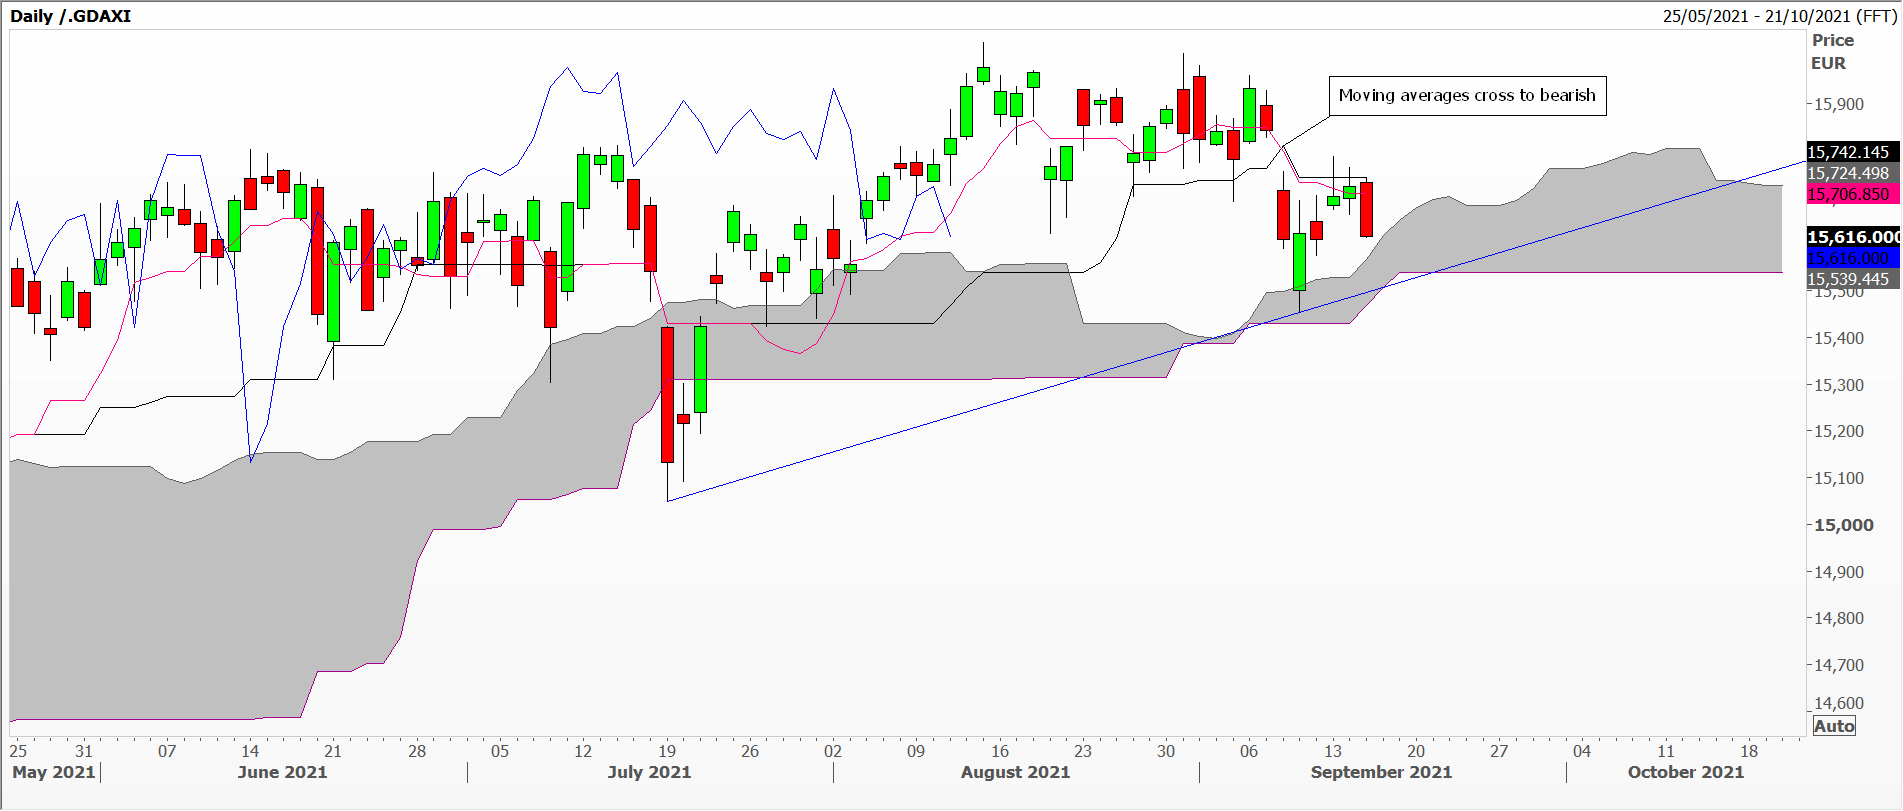 The final daily chart formed a bearish engulfing candle on Wednesday, admittedly a modest one, which reinforces the slightly bearish tone since the 9 and 26-day moving averages crossed to bearish. Now let’s see if the cloud supplies support.
Tags: 5 minute charts, DAX index, Economic data, Ichimoku Clouds
The views and opinions expressed on the STA’s blog do not necessarily represent those of the Society of Technical Analysts (the “STA”), or of any officer, director or member of the STA. The STA makes no representations as to the accuracy, completeness, or reliability of any information on the blog or found by following any link on blog, and none of the STA, STA Administrative Services or any current or past executive board members are liable for any errors, omissions, or delays in this information or any losses, injuries, or damages arising from its display or use. None of the information on the STA’s blog constitutes investment advice.


Latest Comments