


How low can we go? What is affected
Since the great financial crisis started a decade ago the Bank of England has slashed its key Bank Rate to a record low 25 basis points. To keep people on their toes all along they have been promising that any moment now things will have improved and that everything will go back to ‘normal’. This so-called ‘forward guidance’ has had the pernicious effect of preventing individuals and corporates from taking brave, long term decisions with borrowing requirements. Thus the central bank shoots itself in the foot as extreme caution becomes entrenched.
As Merryn Somerset Webb wrote recently in FT Money, ‘Andy Haldane, chief economist of the Bank of England, reckoned that rates were (and still are) the lowest they have been for around 5000 years’. I wish I could see exactly where he’s getting his data from. For a couple of UK financial instruments I have data that goes back a maximum of 200 years; agricultural price charts are available on a handful of commodities for another few hundred.
Ms Webb continues, ‘perhaps it is low rates themselves that cause most of our problems. The knowledge that rates are lower than inflation – that cash in a deposit account is worth less every year – has created a dread risk among savers that they will never accumulate enough to live at all, let alone to live well in their retirement’.
I believe that ultra-low interest rates also prevent efficient asset allocation, negate necessary creative destruction, and subdue price action. Markets no longer see the sharp swings and roundabouts they would under tight credit conditions as investors are forced to slash positions. This then feeds into historical volatility and from there to implied volatility.
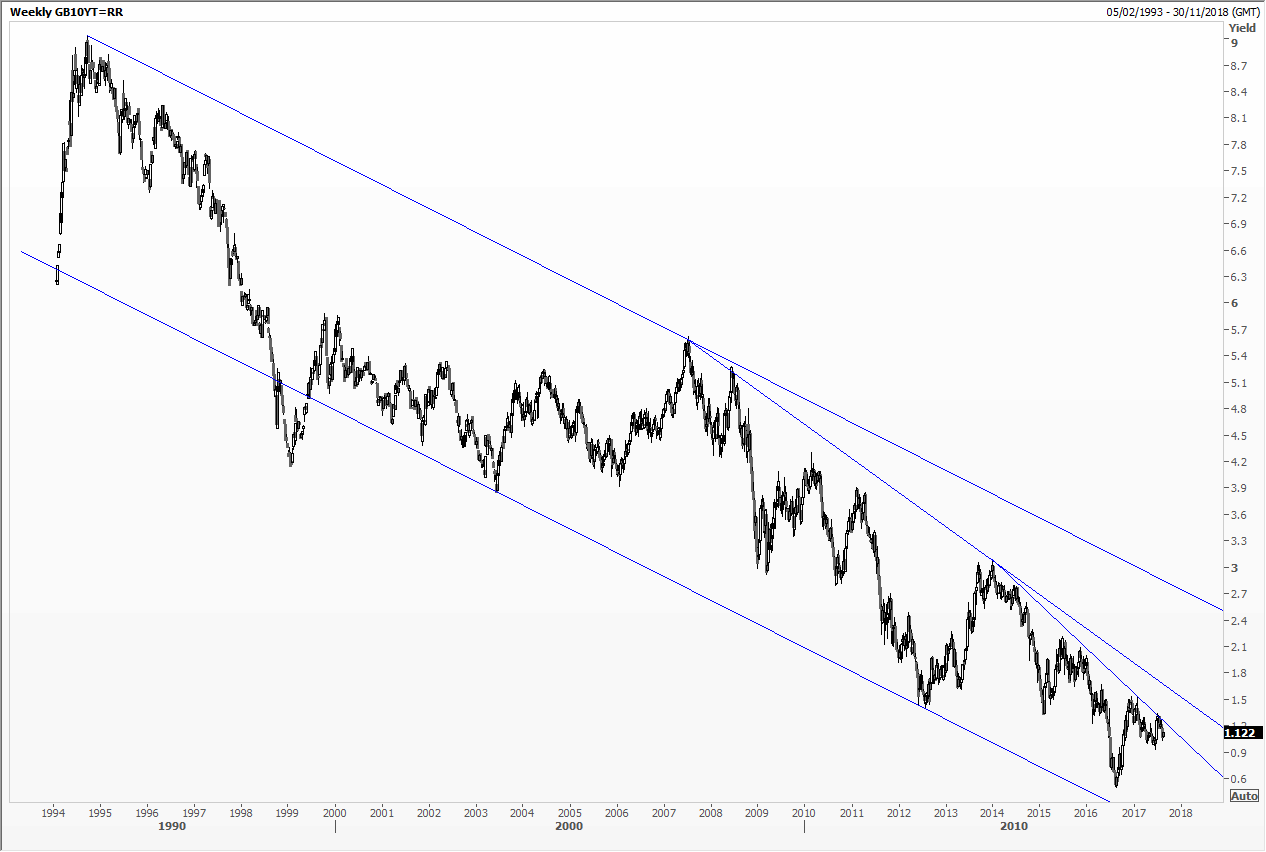
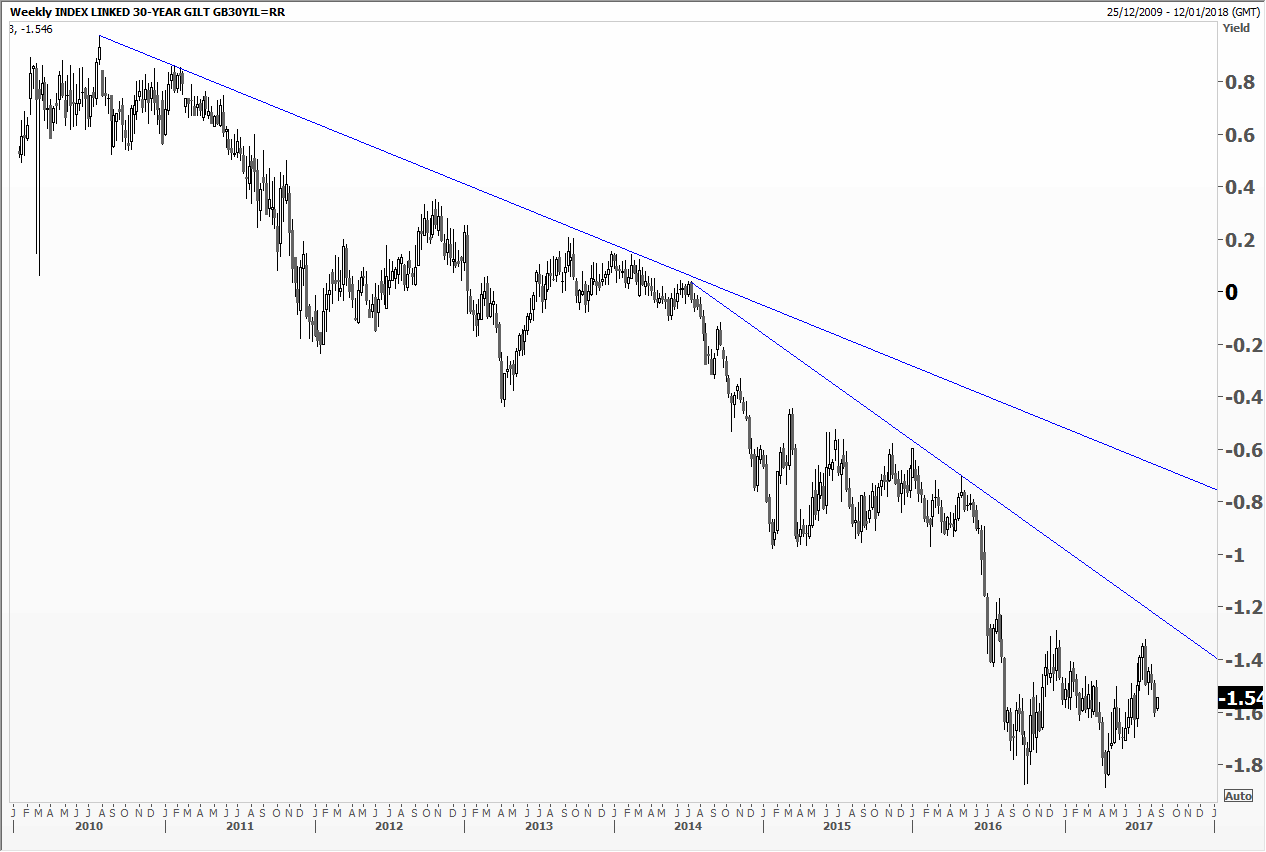
Look at the charts below, the yield of a generic 10-year Gilt and that of a 30-year Index Linked Gilt (where RPI is 3.6 per cent). What you see is the relentless trend to lower rates, in the UK (and across many other countries because bond yields are relative), which has dominated in the US since 1980. The trend is secular, global, and must reflect not just central bank decisions but underlying supply and demand. As I see it there is nothing on the chart to suggest the end is nigh. For now, anyway!
The views and opinions expressed on the STA’s blog do not necessarily represent those of the Society of Technical Analysts (the “STA”), or of any officer, director or member of the STA. The STA makes no representations as to the accuracy, completeness, or reliability of any information on the blog or found by following any link on blog, and none of the STA, STA Administrative Services or any current or past executive board members are liable for any errors, omissions, or delays in this information or any losses, injuries, or damages arising from its display or use. None of the information on the STA’s blog constitutes investment advice.


Latest Comments