


Long term charts: Like gold dust
Throughout my career I have placed an inordinate value on long term charts. In this day and age of on-line information, where allegedly everything is available at the touch of a button, scratch a little and you’ll find this is not so. Every terminal seller in town will tell you they have FX data going back to 1972 (or whatever) and then, once you’ve signed on the dotted line, you find its only for cable and not the Australian and Singapore dollars, or whatever else you might need.
You hunt around, come across some which have a more comprehensive coverage (in the UK DataStream being possibly the best) only to find they cost an arm and a leg. So over the years I have resorted to cutting out, keeping, and photocopying any nice charts I see.
Then you get on to the question of whether the data can be relied upon. Are they quoted or traded prices? Makes a massive difference as you can quote anything you want if you know you won’t have to deal on it. Is it an active market or something that changes hands once in a blue moon? Is it a level playing field and do market makers provide continuous coverage?
The bit I like most: REALLY long term history which gives a very different sense of perspective. Prices adjusted for inflation and for currency depreciation (and occasionally appreciation) allows one to really sit and think, to decide where we are in the scheme of things.
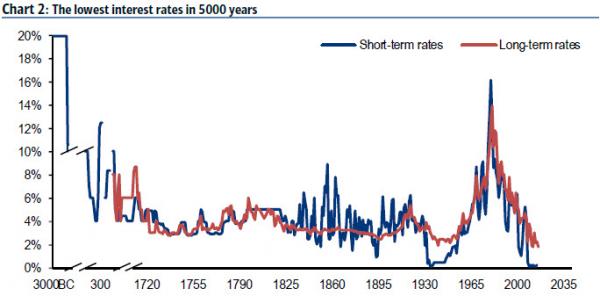
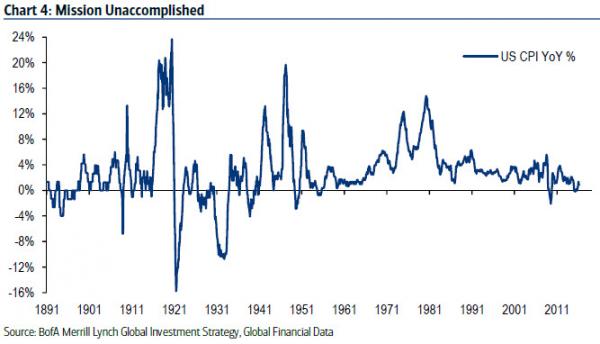
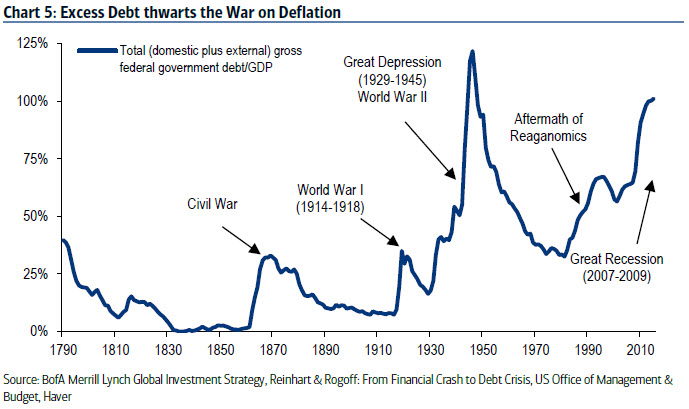
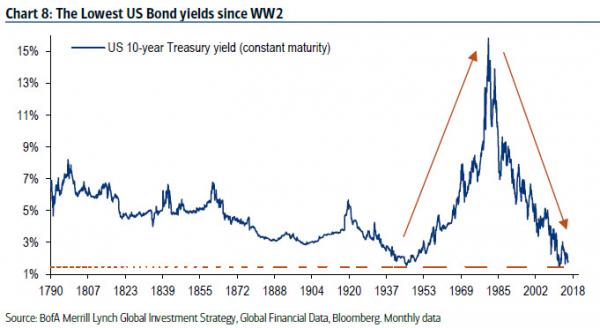
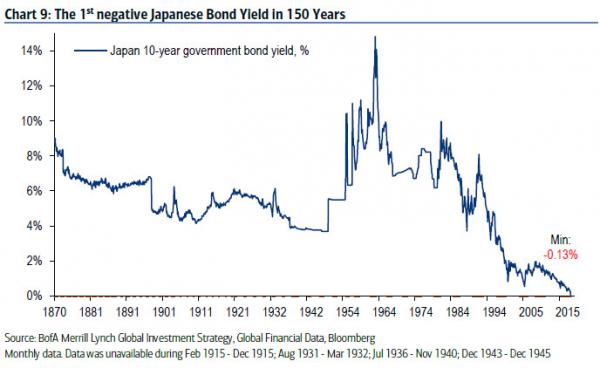
For this opportunity I have to thank Michael Hartnett of Bank of America Merrill Lynch who last week sent out a piece entitled ‘The 5000 Year Long Run’. I can only trust his data, and wonder where he managed to get some of it, but eye-opening it certainly was. I attach the charts, the first one of the theoretical rate for borrowing money going back to the Bronze Age the most far-fetched. The others are presented with no further comment.
I think all technical analysts, and those of other persuasions, will agree that we live in extreme, topsy-turvy times. The lowest interest rates in generations and negative ones in Japan for the first time since 1870; US stocks at their most expensive to Europe in 60 years; bank shares at their lowest relative to their indices in 75 years. The list goes on.
Enjoy these gems!
Tags: debt, deflation, Long term history, yield
The views and opinions expressed on the STA’s blog do not necessarily represent those of the Society of Technical Analysts (the “STA”), or of any officer, director or member of the STA. The STA makes no representations as to the accuracy, completeness, or reliability of any information on the blog or found by following any link on blog, and none of the STA, STA Administrative Services or any current or past executive board members are liable for any errors, omissions, or delays in this information or any losses, injuries, or damages arising from its display or use. None of the information on the STA’s blog constitutes investment advice.


Latest Comments