


Jittery January markets face the Fed and US Q4 GDP: Against a background of high inflation and a record trade deficit
US equity indices kicked off 2022 with an anxiety-driven down draft – not downward dog. This week they faced a two-day Federal Reserve meeting, one which had been threatening ‘gradual’ interest rate rises; Wednesday evening financial markets were told that the Fed would now be as ‘nimble’ as needed. Make of that what you want.
With a record monthly trade deficit at over USD 100 billion, Omicron, and inflation running at its highest in almost four decades, unsurprisingly Reuters estimates for Q4 GDP ranged widely from +3.4% to +7.0%; the result was well above the mean expected (+5.5%) at +6.9%. The GDP Product Price Index printed at +7.0%, its highest in at least 14 years. So, good in parts.
Against this background, how did the S&P 500 e-mini futures contract (currently seen as the bell-weather for retail sentiment) behave? Chart 1 shows the overnight price action on a 5 minute chart ahead of the data release, with prices inching to higher highs helped by the moving averages and Ichimoku clouds on this very short-term basis. Chart 2’s daily timeframe shows how in fact the market has, since late Friday, consolidated in the middle of the range following the decline of the previous fortnight. The market is oversold on the RSI and, at the bottom of the Bollinger band and, despite media hype, historical volatility at 15% is really not exceptionally high.
Price action so far this month might be seen as a correction in the form of a potential inverted pennant. Rather than what happens later today, more important will be weekly (tomorrow evening) and the monthly close on Monday the 31st January. Add to this the Chinese Lunar New year which starts with the new moon Tuesday the 1st February which may – or may not – involve a huge migration of citizens from metropolitan areas to the countryside for a family break. I suggest more of these thin and nervous markets.
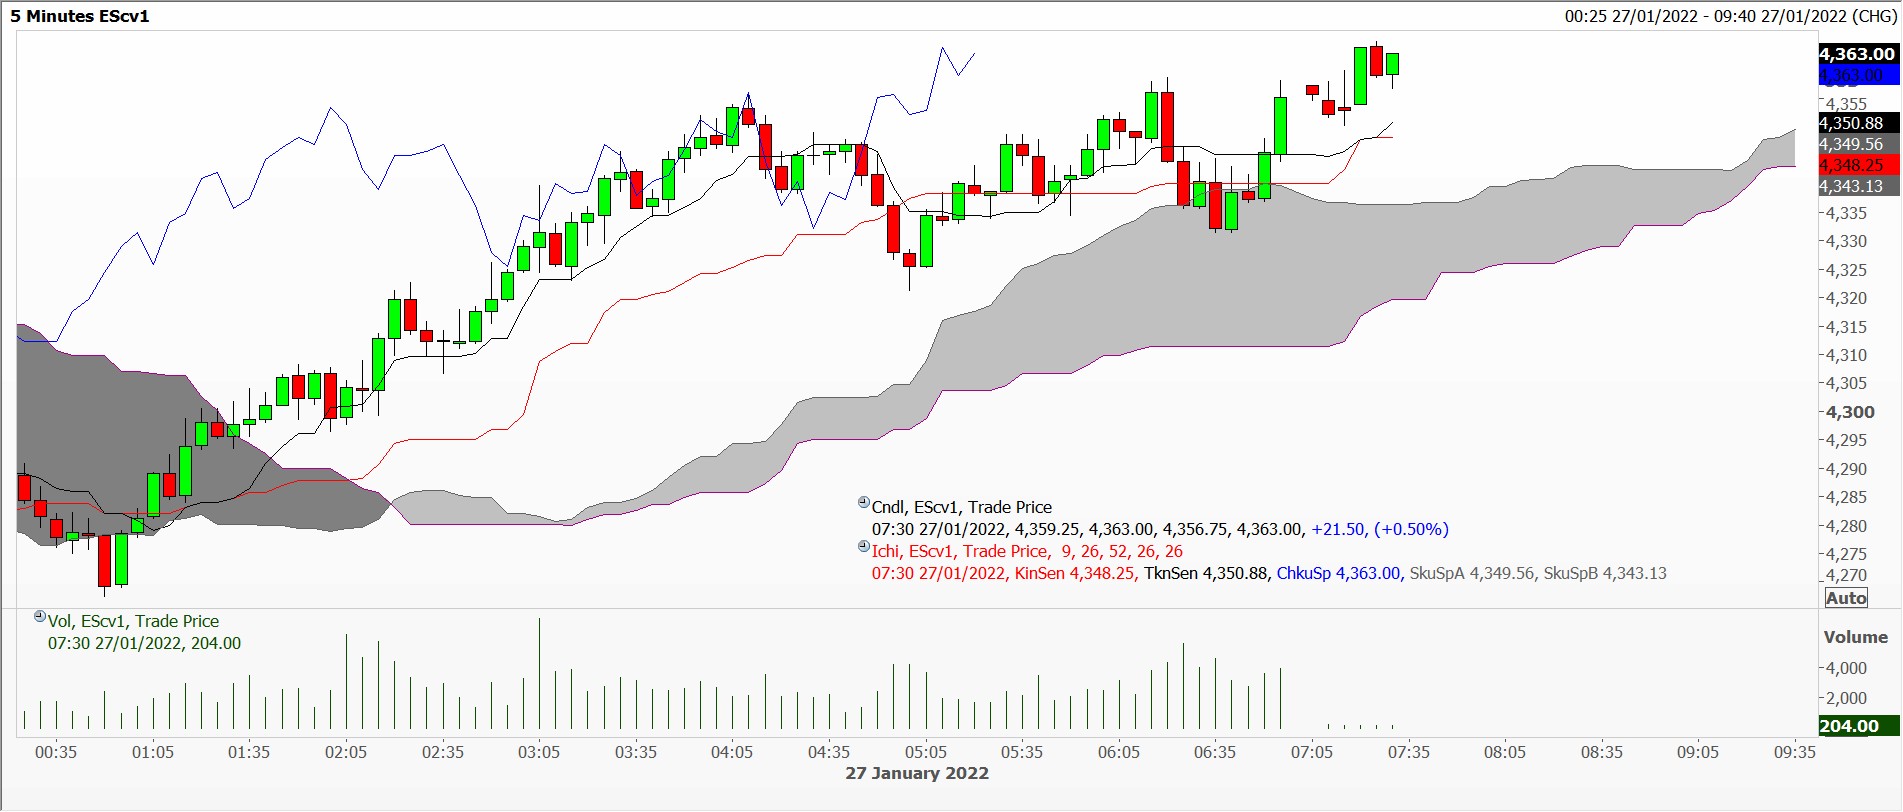
Chart 1
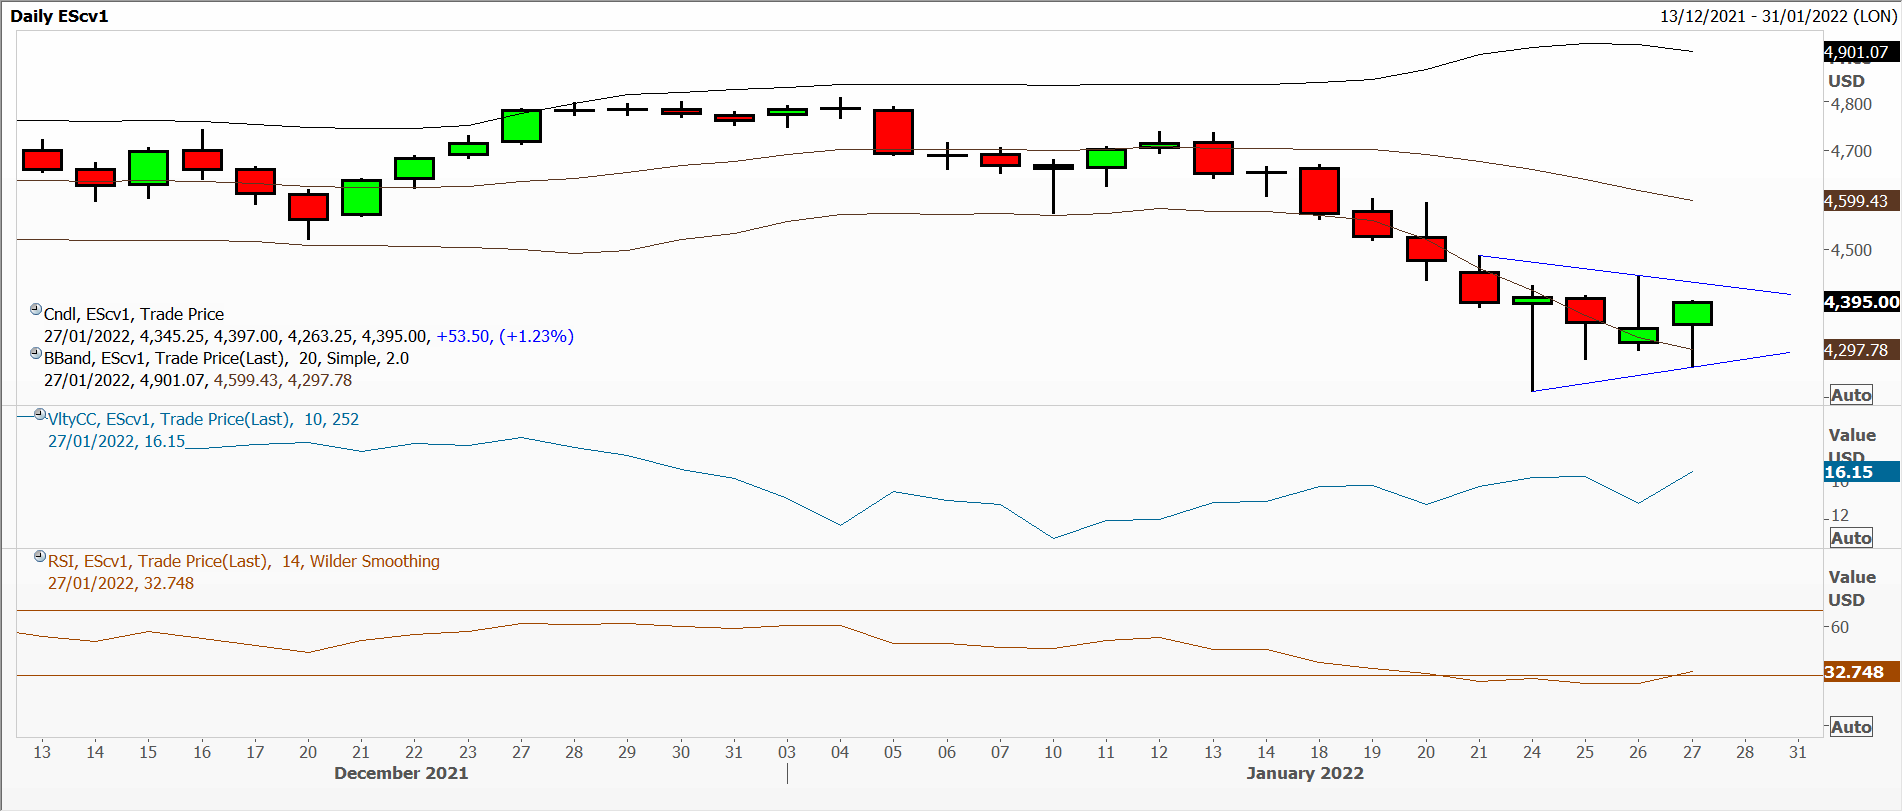
Chart 2
Tags: data, January, nerves, volatility
The views and opinions expressed on the STA’s blog do not necessarily represent those of the Society of Technical Analysts (the “STA”), or of any officer, director or member of the STA. The STA makes no representations as to the accuracy, completeness, or reliability of any information on the blog or found by following any link on blog, and none of the STA, STA Administrative Services or any current or past executive board members are liable for any errors, omissions, or delays in this information or any losses, injuries, or damages arising from its display or use. None of the information on the STA’s blog constitutes investment advice.


Latest Comments