


Coincidence, correlation and confluence: Looking at the US stock market from three different angles
In the last week of January US stocks and their indices saw volatility pick up sharply. Mainstream media, which often overlooks business news in favour of something political – or better still gory – at long last jumped on the bandwagon. Turning it into a David versus Goliath story, they woke up to the fact that via social media, many were getting their financial news, trading tips, and were possibly using the format to create the muscle power to take on the big hitters.
Why on earth do they think this is something new? The Great Financial Crash of 2008/2009 exposed the extensive use of Bloomberg and Reuters ‘chat’ functions, personal mobile phones and lap tops to swap exchange pricing and tactics. Today I was sent an email with the following:
We share an article below on the challenges of monitoring personal devices written by members of the financial regulatory group at law firm McGuireWoods. Their piece notes that “broker-dealers must remain keenly attuned to the risks posed by work-from-home arrangements, including the risk that registered representatives…use their personal devices or other unapproved and unmonitored channels to communicate with clients and conduct business.”
In the three charts attached to this piece, I look at the price action of the S&P 500 index in a daily chart including the week of 25th to 29th January, a weekly chart of the whole of January (and the bit beforehand), plus a monthly chart of January 2020 with a lot more history. The object of the exercise was to gauge whether, despite the hype, the moves were significant.
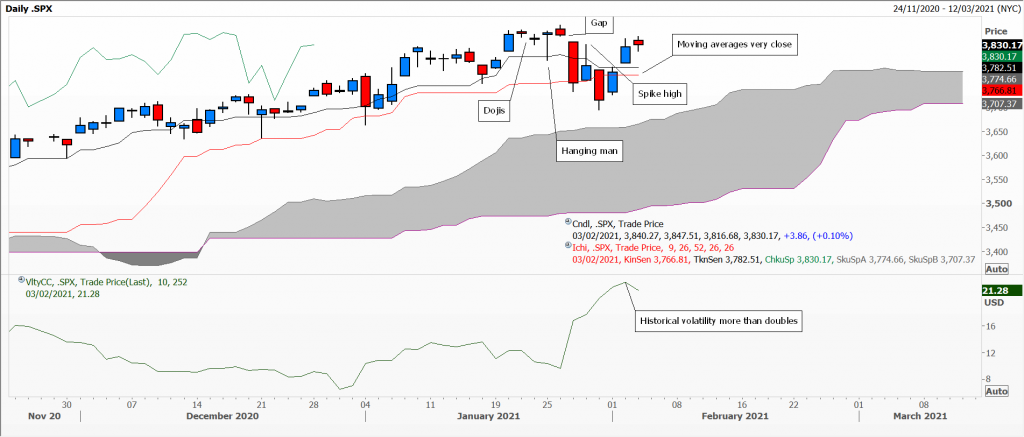
The daily Ichimoku chart shows a slow, but steady, upward trajectory to a new record high at 3870 on Tuesday. On the Thursday and Friday before that were two small doji candles denoting instability. Monday’s hanging man underscores this pair, with the opening gap on Wednesday, and Thursday’s spike high led to Friday’s close near the low of the week.
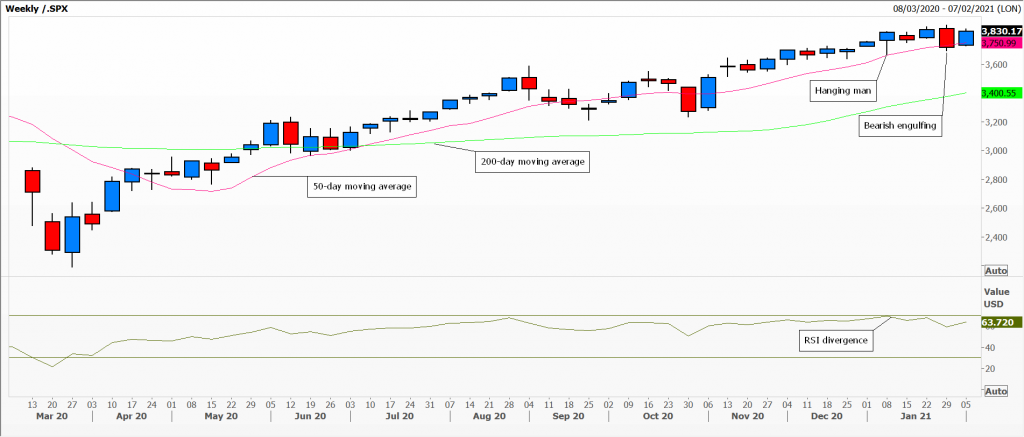
Over the week we have a bearish engulfing candle, again mimicking the hanging man candle of the first week in January. Note also that like the Ichimoku averages, prices are now dallying with the 50-day moving average, plus the Relative Strength Index is diverging, not posting a new overbought reading at the record high.
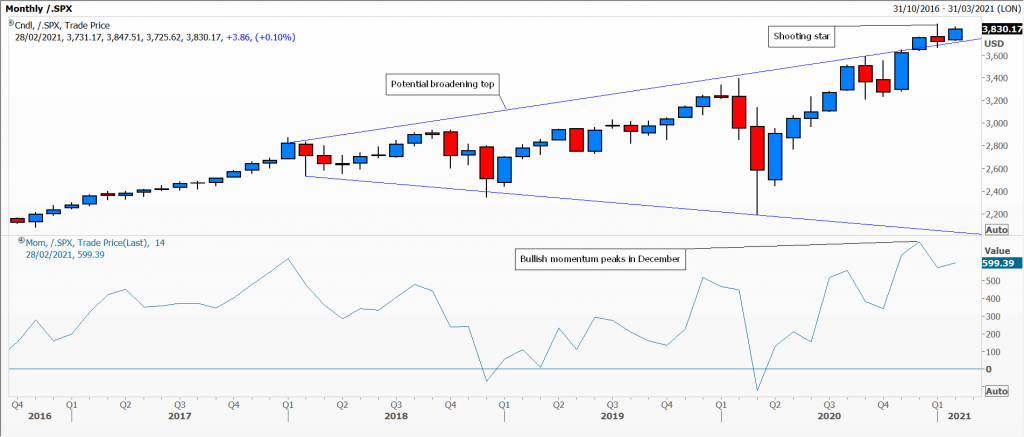
Finally the monthly chart shows a small shooting star, following an unsurprisingly small range in December, just above an interminable potential broadening top chart pattern – on decreasing bullish momentum.
This is meant as an educational piece, not a market outlook, but underscores the importance of taking in the broader picture. In the same vain, if you had believed the hype about the so-called ‘surge’ in the price of silver, a quick look at spot gold, platinum and palladium, would have been helpful.
Caveat emptor.
S&P1
S&P2
S&P3
Tags: Ichimoku Clouds, moving averages, S&P 500, Silver
The views and opinions expressed on the STA’s blog do not necessarily represent those of the Society of Technical Analysts (the “STA”), or of any officer, director or member of the STA. The STA makes no representations as to the accuracy, completeness, or reliability of any information on the blog or found by following any link on blog, and none of the STA, STA Administrative Services or any current or past executive board members are liable for any errors, omissions, or delays in this information or any losses, injuries, or damages arising from its display or use. None of the information on the STA’s blog constitutes investment advice.


Latest Comments