


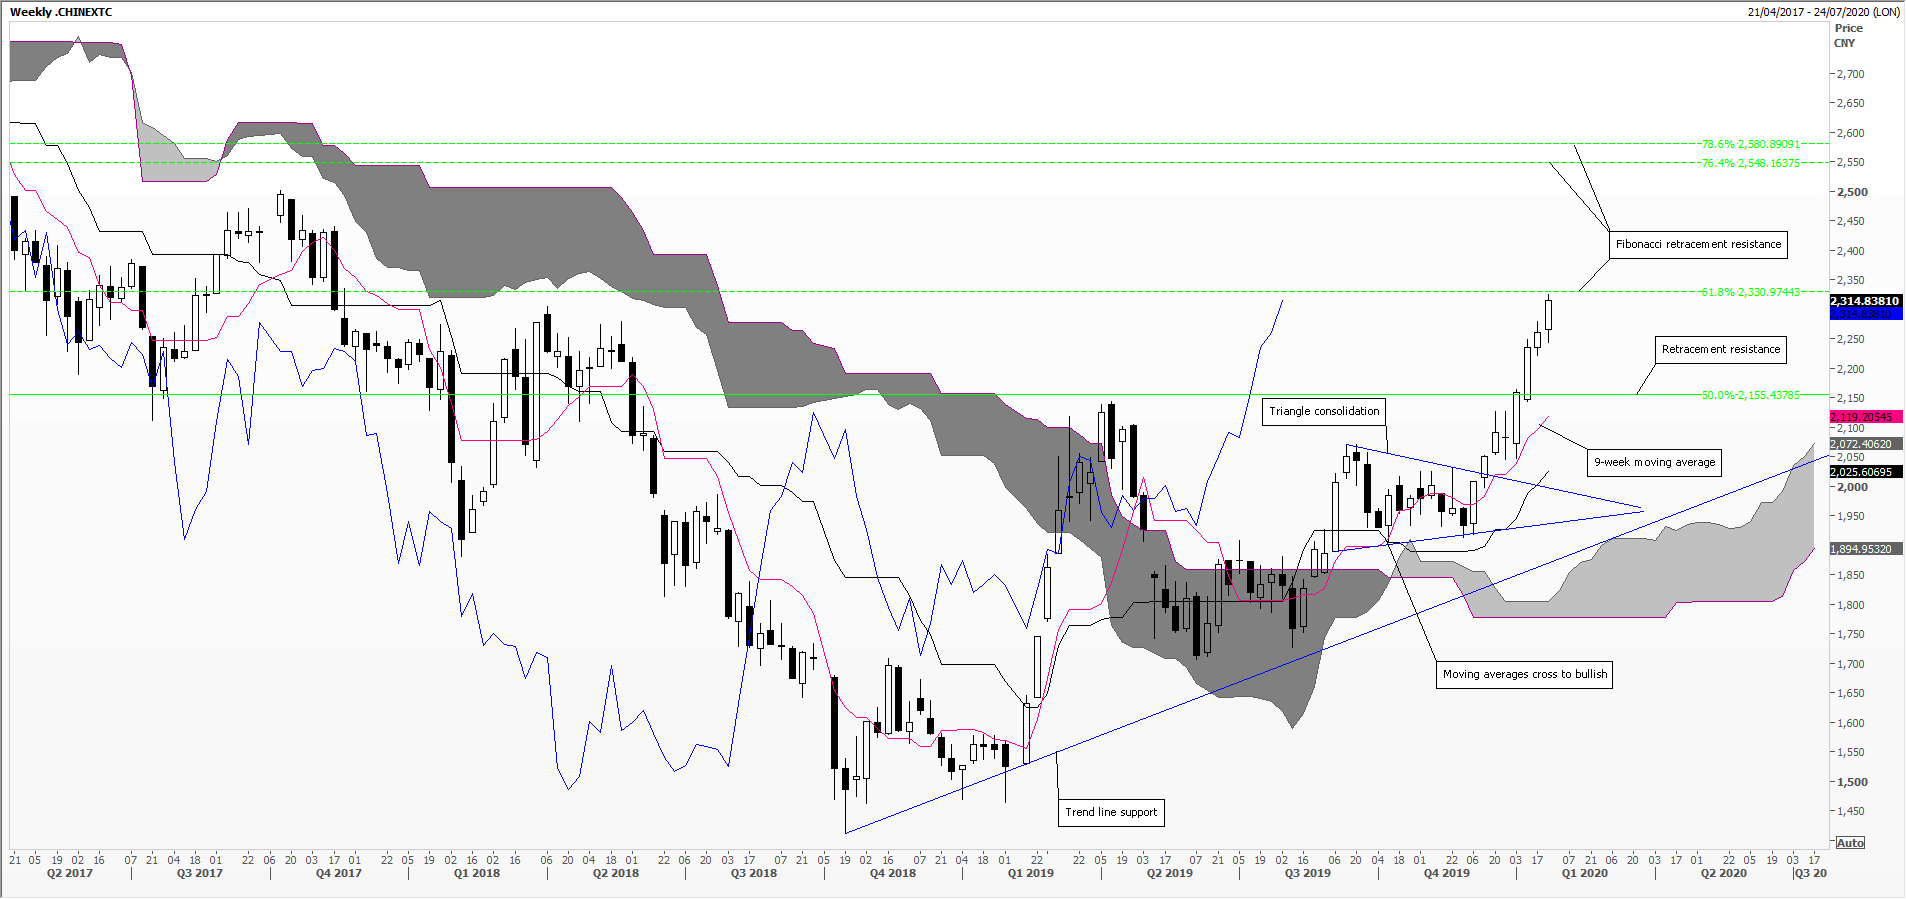
ChiNext Composite the outperformer
Just over a month ago, we wrote that the index of all shares listed on the Growth Enterprise Board, the ChiNext, had broken up out of a small symmetrical triangle, and should rally to retracement resistance at 2155. It’s got there and more, up 7.6 per cent since the beginning of this year, outpacing other Chinese stock indices. Investor interest is clear, average daily volumes doubling since the early December low point, yet observed volatility low by historical standards. We’re now hovering just under 61 per cent Fibonacci resistance, and it’s overbought on the Relative Strength Index indicator, so expect some hesitation here. Then on up again to final Fibonacci retracement resistance around 2550-2580.
Tags: ChiNext, Fibonacci, relative strength
The views and opinions expressed on the STA’s blog do not necessarily represent those of the Society of Technical Analysts (the “STA”), or of any officer, director or member of the STA. The STA makes no representations as to the accuracy, completeness, or reliability of any information on the blog or found by following any link on blog, and none of the STA, STA Administrative Services or any current or past executive board members are liable for any errors, omissions, or delays in this information or any losses, injuries, or damages arising from its display or use. None of the information on the STA’s blog constitutes investment advice.


Latest Comments