


‘Beware the Ides of March’: Remembering to keep a sense of proportion
Shakespeare’s Julius Caesar came to a sticky end on the 15th of March, lending the phrase negative connotations ever since. In fact, an Ide is a very ancient word for certain dates in the calendar, the first full moon of the month (March, in this case). Tonight, the 7th April, we have another full moon, a pink super bright one as the moon’s elliptical orbit around the earth brings it closer to us than usual. It actually looks orange, and the ‘pink’ comes from the phlox that flowers at this time of year.
The full moon on Monday 9th of March marked the day when the widely watched Dow Jones Industrial Average had lost 20% of its value since February’s record high. Conventional wisdom clings to the concept that this is the minimum move required to decide if a market has turned.
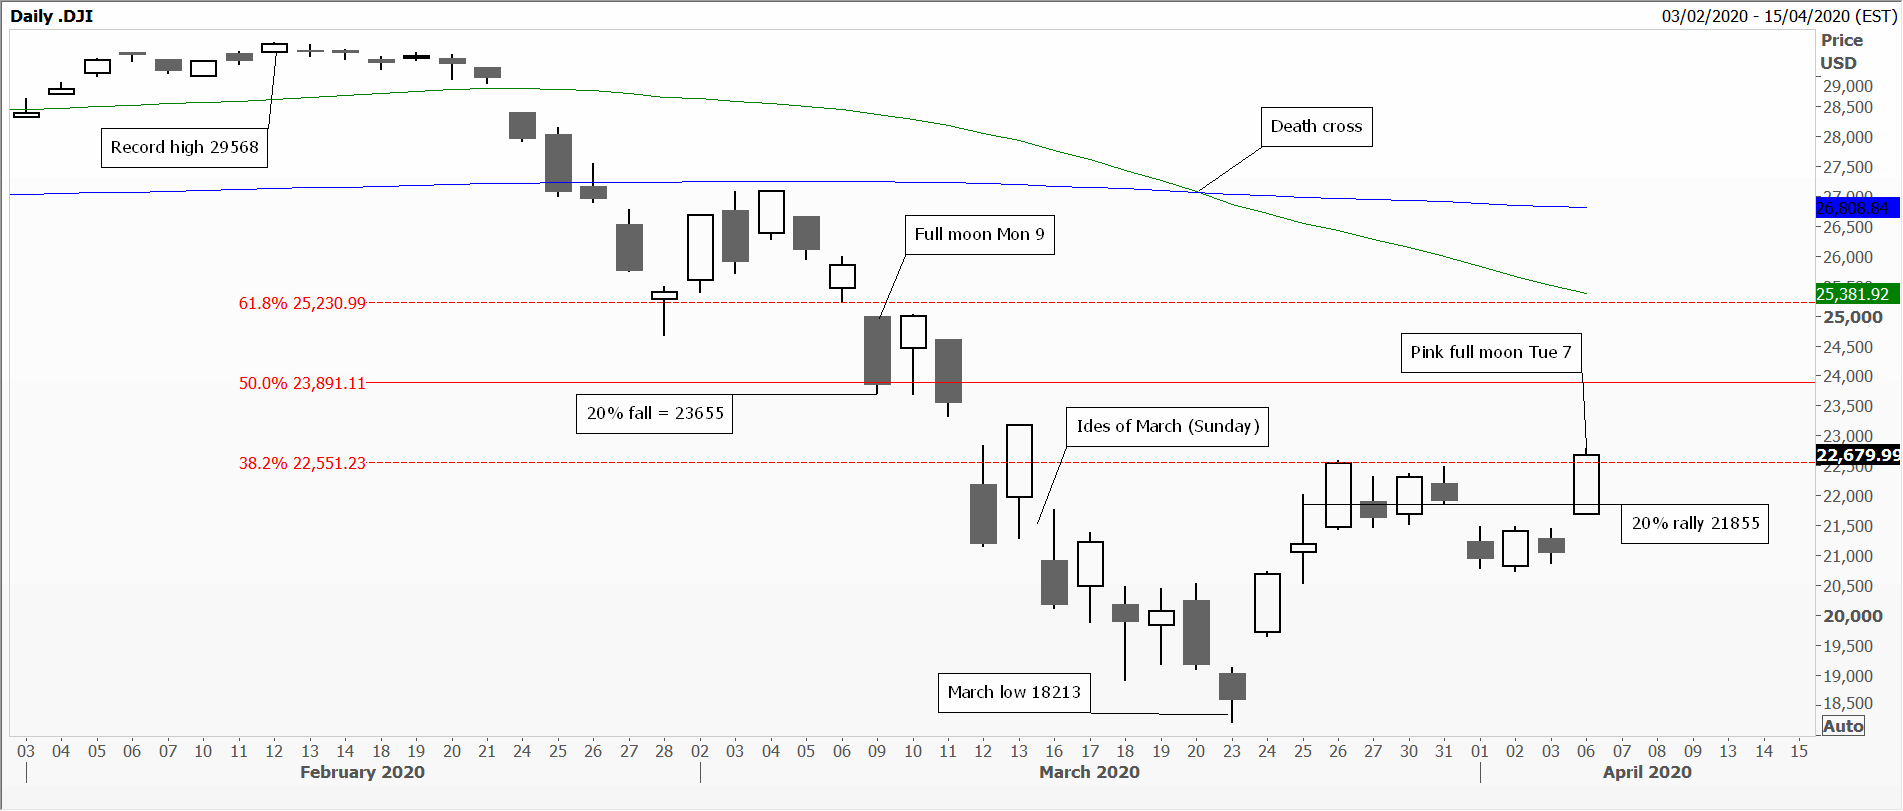
DJIA
As we know, bull and bear markets are often asymmetrical, and the law of small versus big numbers means that a 20% rally from the March low requires just 3642 points whereas on the way down it needed 5913 points to label a turn in trend; this was achieved last Wednesday. I’m wondering whether tonight investors will be keeping their fingers crossed hoping the latest bounce, capped at a Fibonacci 38% retracement, will not peter out.
March’s slump has been widely documented as one of the biggest monthly losses in equity markets in a very long time. Daily moves in US indices have been of the order of nearly 5%, reflected in both historical and even more so in implied volatility. Standing back a bit, quarterly moves of this magnitude are more common than one might think. My example here is the MIB index of Italy’s top 40 shares. Since embracing the cult of the equity in the mid-1990s, it’s been downhill all the way, coupled with the extraordinary power of secular Fibonacci retracement resistance at 38%.
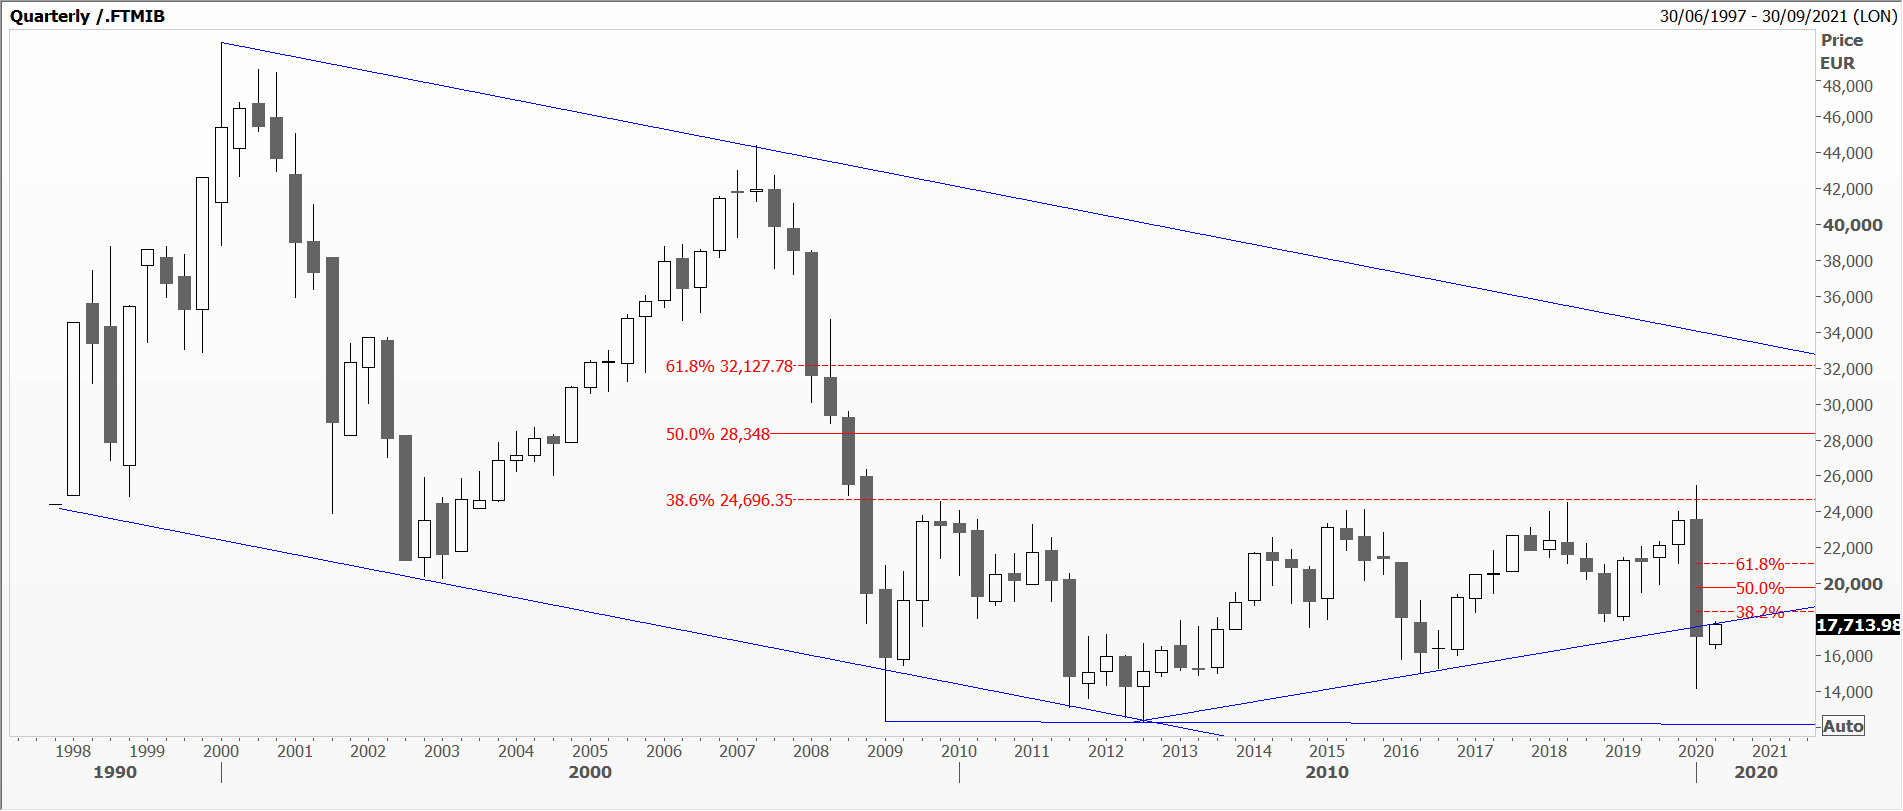
MIB
A final one for you to ponder: Brazil’s Bovespa index which has been helped over the years with interest rate cuts, now at a record low. The biggest ever fall from January’s record high and a big number at 119593, by March’s low of 67802 it had managed to lose 43% of face value. Trouble is, the Brazilian real had also simultaneously lot 33% of face value against the US dollar, meaning US investors in this emerging market saw 76% of their cash wiped out. Oops!
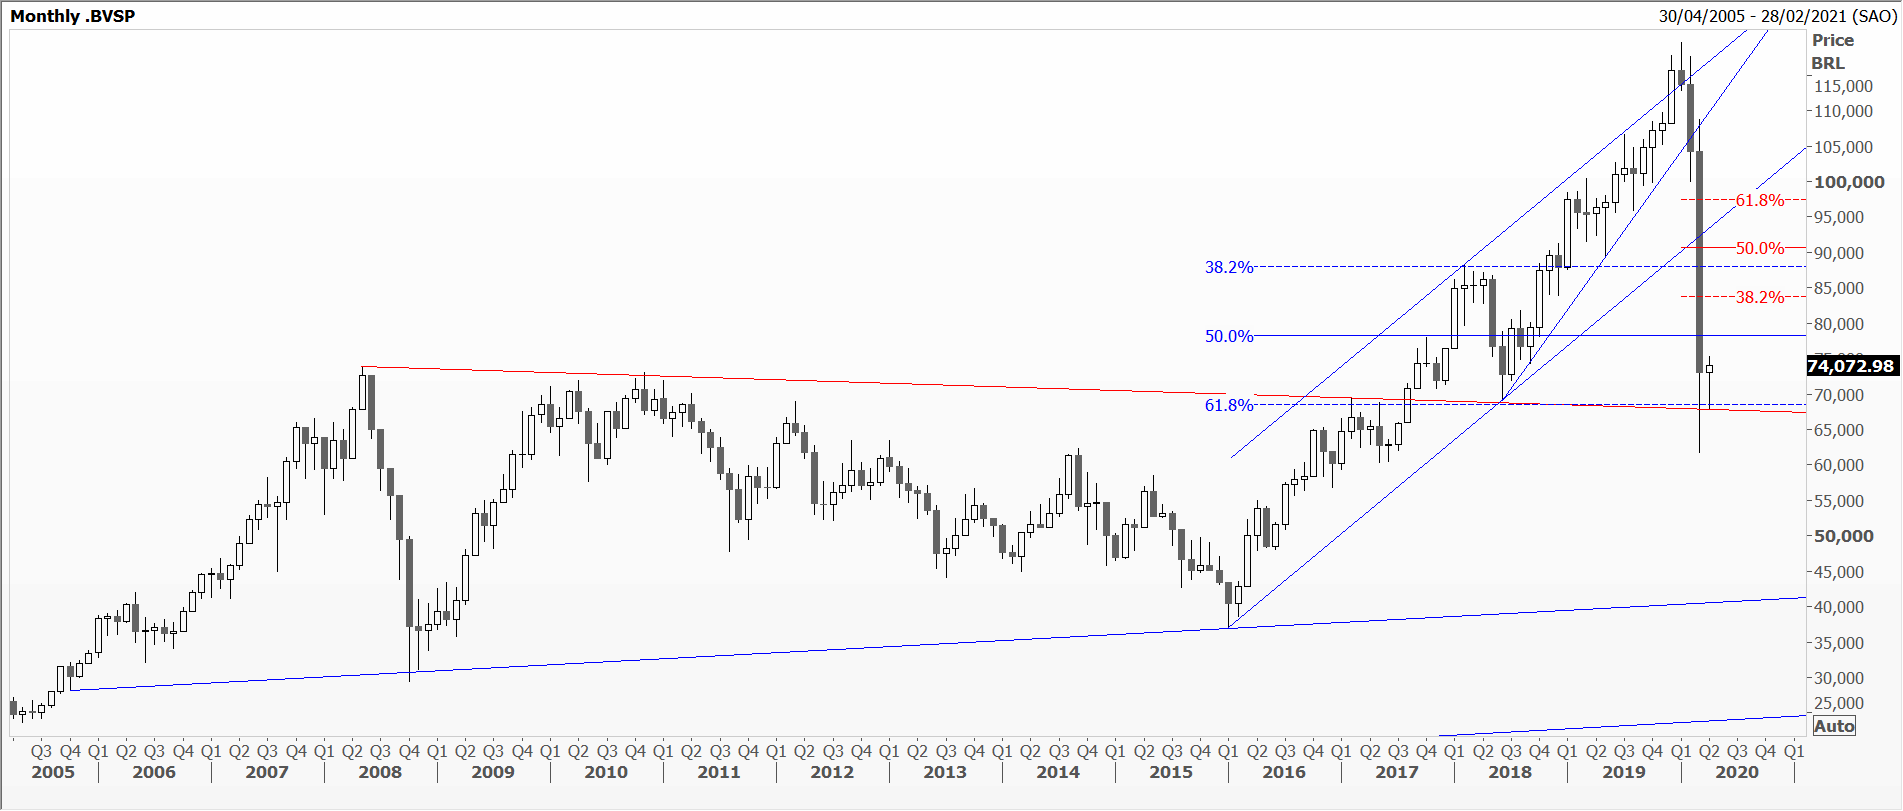
Bovespa
Tags: Bear, Bull, percentage, Proportion, Technical Analysis Courses
The views and opinions expressed on the STA’s blog do not necessarily represent those of the Society of Technical Analysts (the “STA”), or of any officer, director or member of the STA. The STA makes no representations as to the accuracy, completeness, or reliability of any information on the blog or found by following any link on blog, and none of the STA, STA Administrative Services or any current or past executive board members are liable for any errors, omissions, or delays in this information or any losses, injuries, or damages arising from its display or use. None of the information on the STA’s blog constitutes investment advice.


Latest Comments