


IFTA presents: ‘The Rising Star Ichimoku Strategy’ by Sankar Sharma
Members of the UK’s Society of Technical Analysts should have received a monthly newsletter with details of upcoming events, news and fixtures. If, for some reason you didn’t receive one, do email info@technicalanalysts.com to make sure you’re added to their mailing list. This is how I found out about a webinar run by IFTA, and hosted by our chair Tom Hicks, yesterday, Tuesday the 19th January 2021.
Expertly organised by linda.bernetich@ifta.org , registration was easy, reminders were sent out, and joining the webinar was a doddle. If as yet you haven’t done one of these, please don’t be put off as I think even my aged mother could manage it first time round.
Sankar Sharma, with 32 years of market experience, says he’s ‘’passionate about technical analysis’’ and has spoken and written on the subject of Ichimoku charts several times. He’s trademarked ‘The Rising Star’, and I’m not entirely convinced whether it refers to his proprietary method or himself!
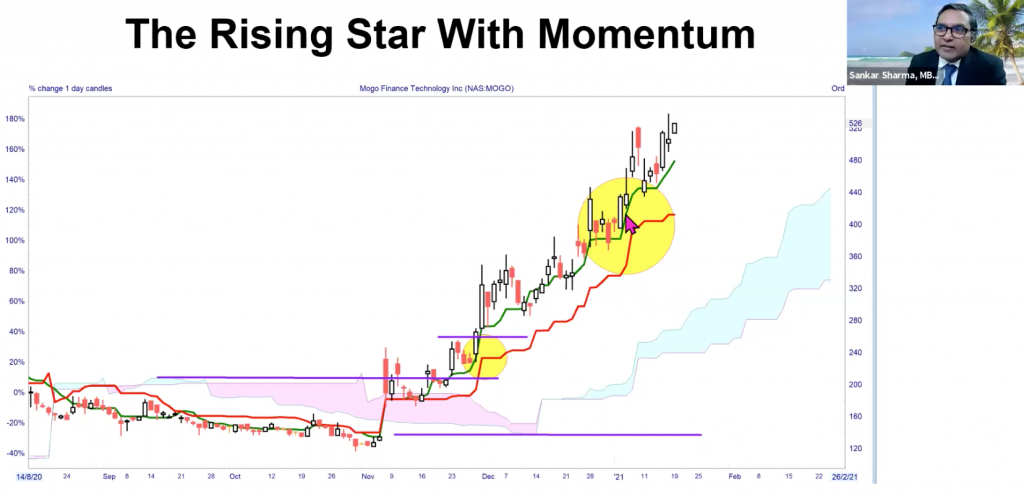
Using clear daily charts, with white and red (down days) candles, he gives a whirlwind recap of the method, explains what he refers to as ‘’hidden support and resistance’’, the formation of ‘’pivots’’ – key to his thinking – entry and exit points confirmed by three consecutive daily closes above or below key levels.
He then presents a generous series of charts, all running along the same theme: major tech company stocks, all of which seem to have been trundling along in a neat if small range, and then see an explosive move higher. Interestingly he looks at the moving average lines themselves when looking for proof that momentum is bullish. I have a feeling the charts were chosen looking through a rear-view mirror. He adds that his system, with or without the momentum overlay, works in all markets over all time frames. Slight hitch with the presentation: the streaming video of Sankar himself, a small box at the top right of the screen, while we also see each chart slide; this means we cannot see the most recent price action for that share.
As a special offer for IFTA members, he’s running a trading summit on the 3rd and 4th of March which will be free. I’m guessing one can contact him via his website https://www.riskrewardreturn.com
For more info on the International Federation of Technical Analysts’ webinars click here.
Tags: Hidden Support & Resistance, Ichimoku Clouds, Pivot
The views and opinions expressed on the STA’s blog do not necessarily represent those of the Society of Technical Analysts (the “STA”), or of any officer, director or member of the STA. The STA makes no representations as to the accuracy, completeness, or reliability of any information on the blog or found by following any link on blog, and none of the STA, STA Administrative Services or any current or past executive board members are liable for any errors, omissions, or delays in this information or any losses, injuries, or damages arising from its display or use. None of the information on the STA’s blog constitutes investment advice.


Latest Comments