


Variations on a pitchfork: Adding Quartiles
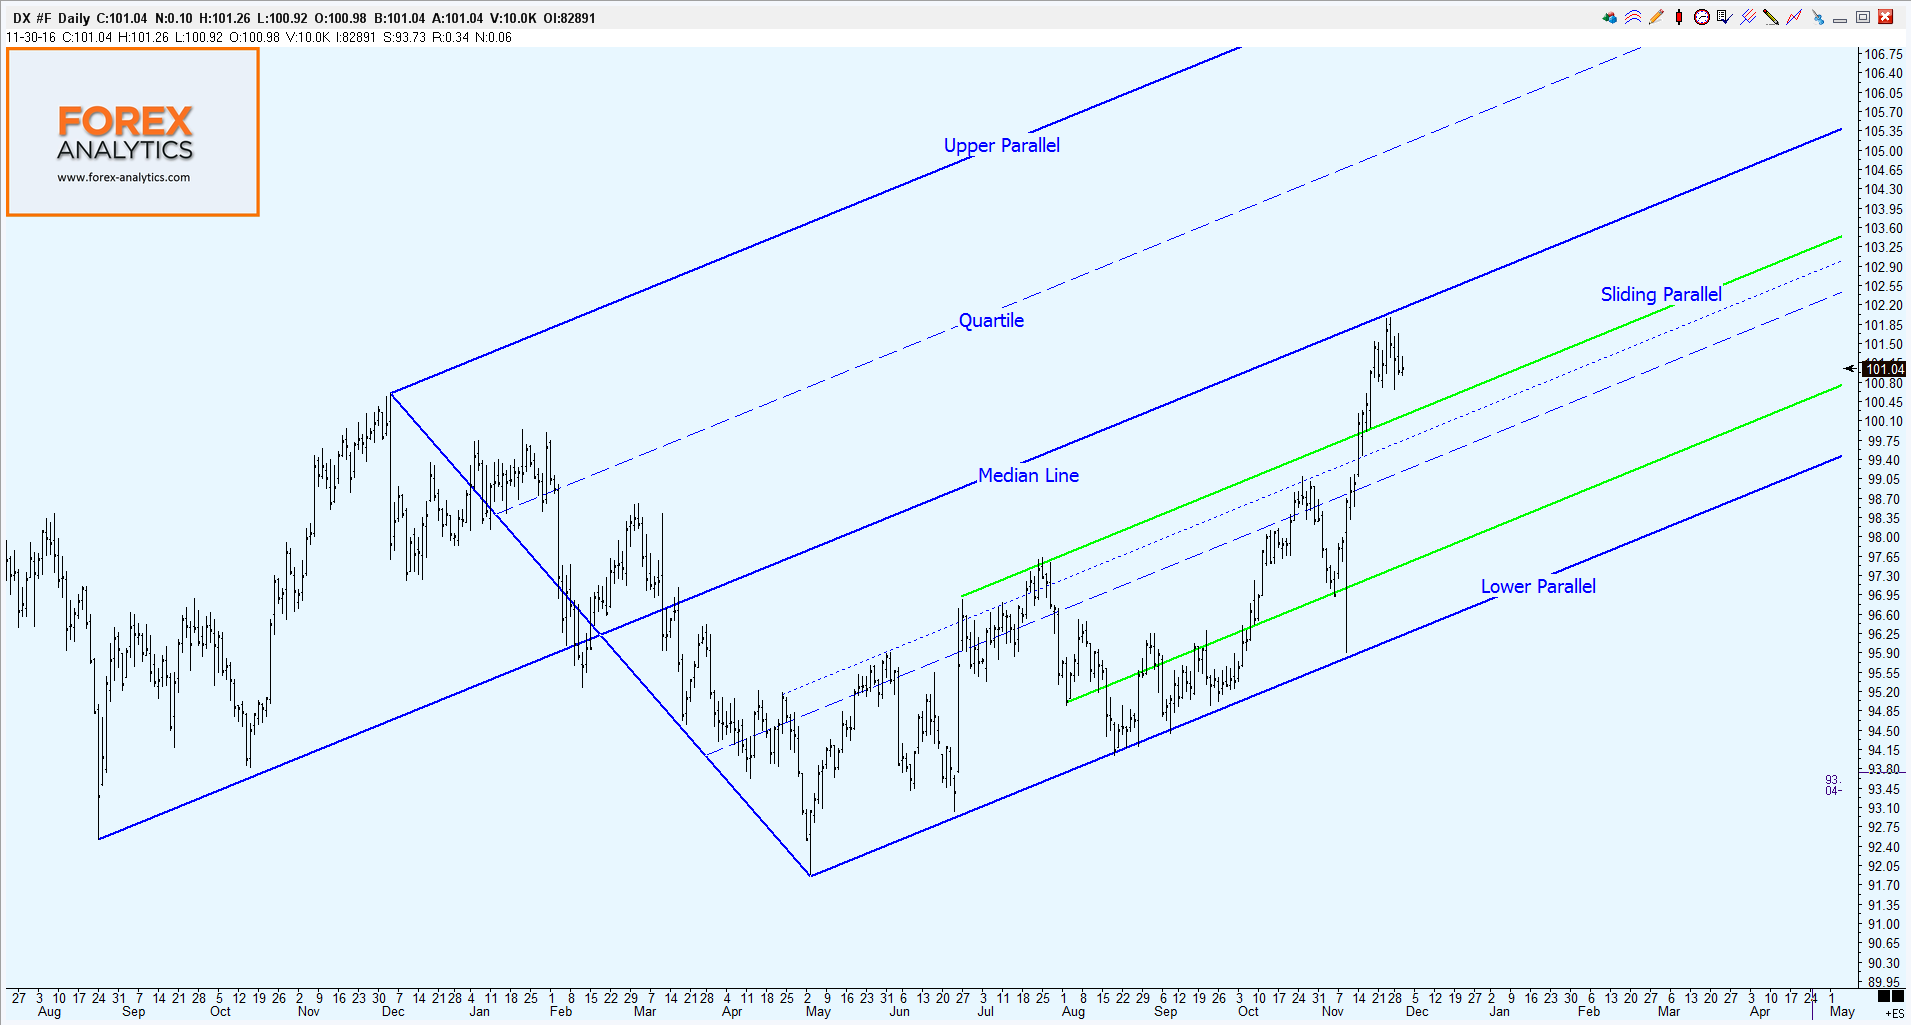
You may not use it yourself, but you’ve probably heard of the Andrews Pitchfork. At first sight it looks like some sort of mean regression with standard deviations either side and, because of this, it is also known as the Median Line Method. But in fact the three lines of the study are not mathematically calculated but are parallels drawn from three separately selected points. The prongs either side of the central one are always equidistant to the central one – which I like to think of as eyeballing a line of best fit.
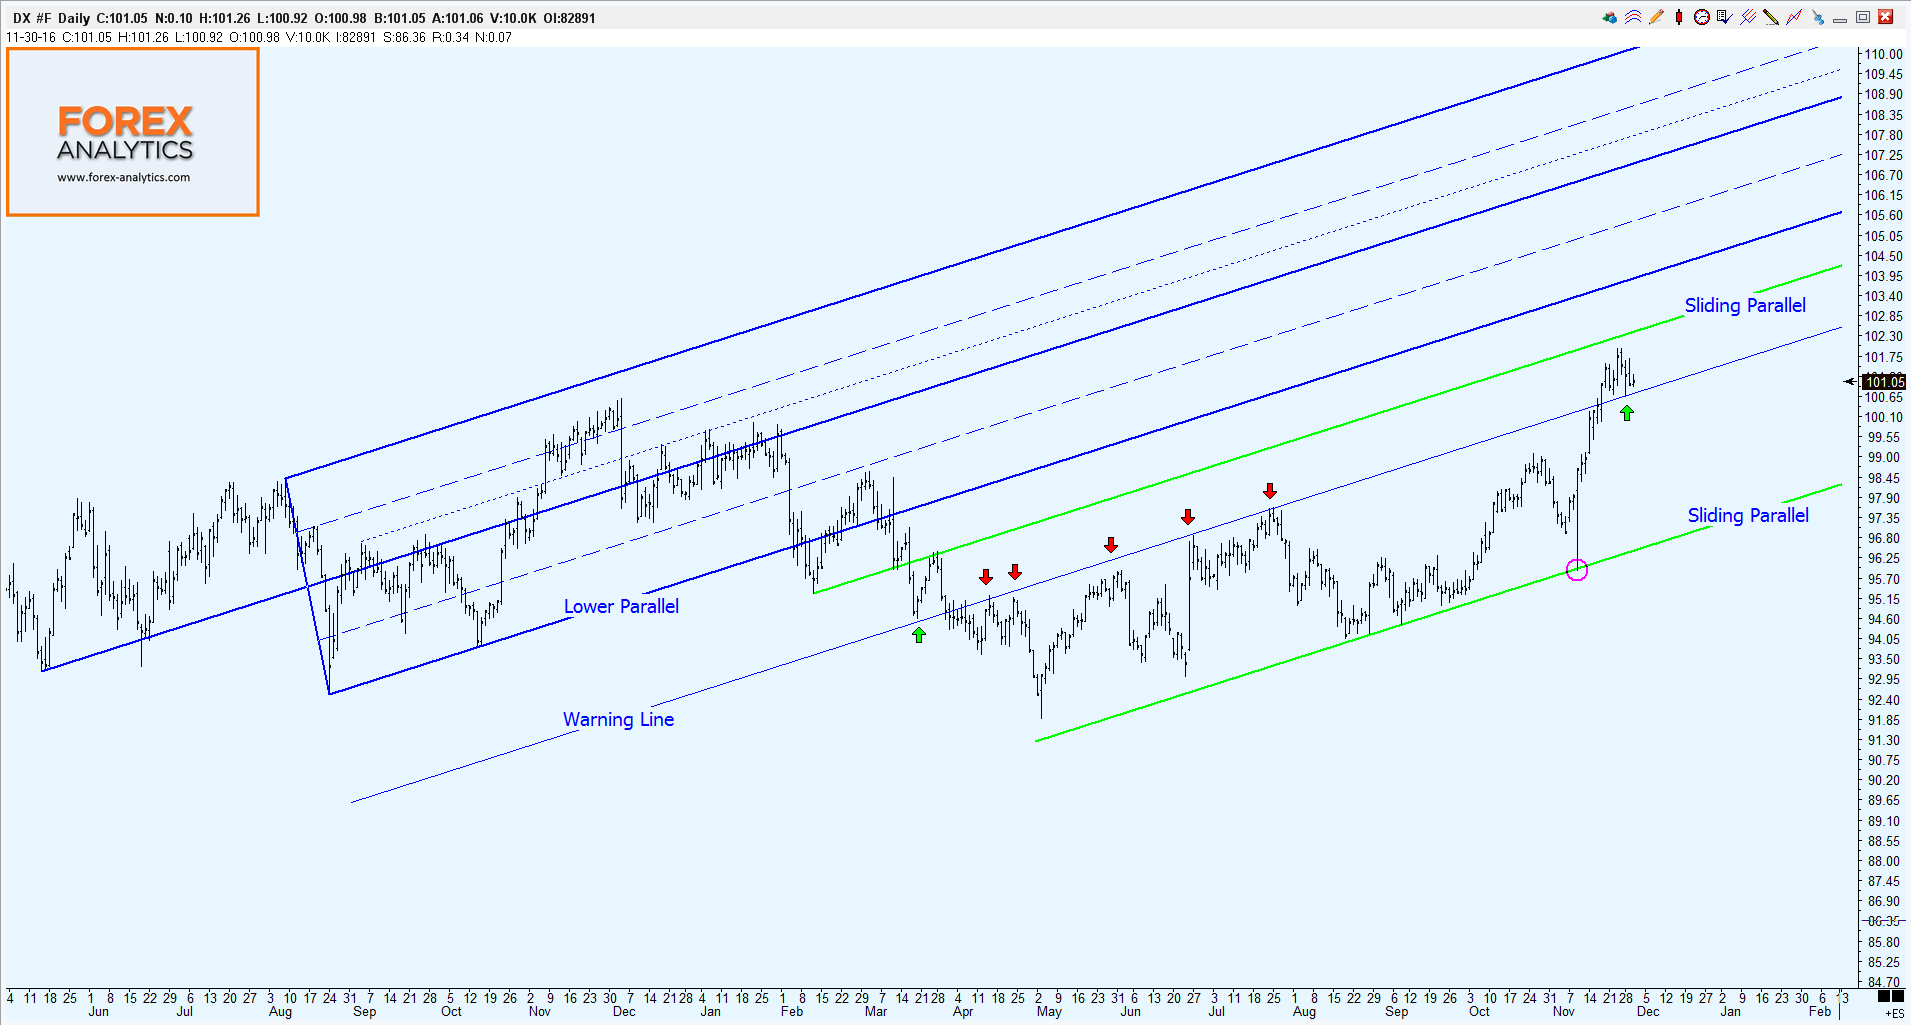
Recently on social media I came across several studies by Ben Drage of fledgling firm Forex Analytics. He uses the pitchfork to identify high probability support and resistance levels. Should prices move outside the outer edge of the fork, rather than discard the analysis or re-draw the lines, he continues using them if he’s happy that they still broadly define the current price path. In other words, a subjective look at the most likely probable trend.
Then he adds what he calls Quartiles, more parallel dashed lines mid-way between the central tine of the fork and its edges. These mark the central point to another set of lines called Warning lines which are the same width as the original pitchfork and lie outside the outer edges of the original. To me it sounds like a sort of band of tolerance. To highlight other important highs and lows he adds Sliding Parallels. Each and every line is given equal weighting in terms of his analysis and views.
Some might find using so many parallels a bit of a straightjacket, and I’m not sure how well the system might work with charts that don’t have time along the bottom axis – like point & figure or Renko charts. Nice to see confident, experienced analysts bending the rules, taking conventional methods to another level. Well done!
And should you be interested, Ben Drage will be hosting a free live webinar on Tuesday 6 December. Click here to register.
The views and opinions expressed on the STA’s blog do not necessarily represent those of the Society of Technical Analysts (the “STA”), or of any officer, director or member of the STA. The STA makes no representations as to the accuracy, completeness, or reliability of any information on the blog or found by following any link on blog, and none of the STA, STA Administrative Services or any current or past executive board members are liable for any errors, omissions, or delays in this information or any losses, injuries, or damages arising from its display or use. None of the information on the STA’s blog constitutes investment advice.


Latest Comments