


Understanding Triple RSI Divergence: A Potential Warning Sign for the S&P 500
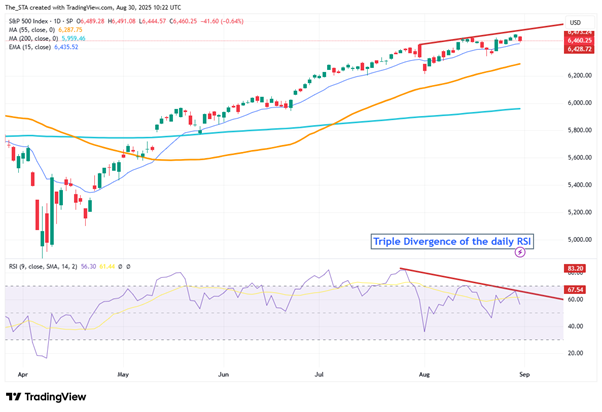
I recently noticed a triple divergence of the daily RSI (Relative Strength Index) on the S&P 500 chart. Whenever I see this pattern, it raises a red flag for me—it often signals a possible correction. Before diving in, please note that this post is purely for educational purposes and not financial advice.
Divergence Basics
The RSI is a momentum oscillator that helps identify overbought and oversold conditions in a market.
Divergence happens when RSI and price action move in opposite directions.
- Bearish Divergence: Price makes higher highs, but RSI makes lower highs → signals weakening momentum.
- Bullish Divergence: Price makes lower lows, but RSI makes higher lows → signals strengthening momentum.
What Is a Triple Divergence?
A triple divergence occurs when this mismatch between price and RSI happens three times in a row on the daily chart. This repetition highlights a stronger and more persistent contradiction between price action and momentum.
Bearish Triple Divergence Example:
- Price: Higher high → Higher high → Higher high
- RSI: Lower high → Lower high → Lower high
Suggests the uptrend is running out of steam and correction risk is rising.
Bullish Triple Divergence Example:
- Price: Lower low → Lower low → Lower low
- RSI: Higher low → Higher low → Higher low
Suggests sellers are losing control and a potential reversal upward may be coming.
Why Triple Divergence Matters
- Daily timeframe signals carry more weight than intraday divergences because they reflect broader market sentiment.
- A triple divergence is relatively rare compared to a single divergence.
- Traders often view it as a warning for a major reversal or at least a significant correction ahead.
Final Thoughts
While no technical pattern guarantees future outcomes, recognising signals like a triple divergence can help traders stay cautious and prepare for potential shifts in market momentum. Always combine these insights with broader market context and risk management practices.
The views and opinions expressed on the STA’s blog do not necessarily represent those of the Society of Technical Analysts (the “STA”), or of any officer, director or member of the STA. The STA makes no representations as to the accuracy, completeness, or reliability of any information on the blog or found by following any link on blog, and none of the STA, STA Administrative Services or any current or past executive board members are liable for any errors, omissions, or delays in this information or any losses, injuries, or damages arising from its display or use. None of the information on the STA’s blog constitutes investment advice.


Latest Comments