


Long term charts: like gold dust
Historical data has value, adds perspective, and is an interesting pursuit in itself. Providers of analytics and technical analysis boast about how far back their charts go; the reality is that this is the case for only a handful of instruments and, because buying back-data is so expensive, they don’t. Storage capacity is also an issue, therefore few keep tic data for longer than a month as bundling into larger time blocks frees up memory space.
So what I have done for years is photocopy any interesting chart I see; now I also download from internet sites so, while I don’t have the raw data, I have a good idea of trends and levels. My rule of thumb is the further back in history the series goes, the more copies I make so that I can scribble all over each sheet, keeping at least one intact.
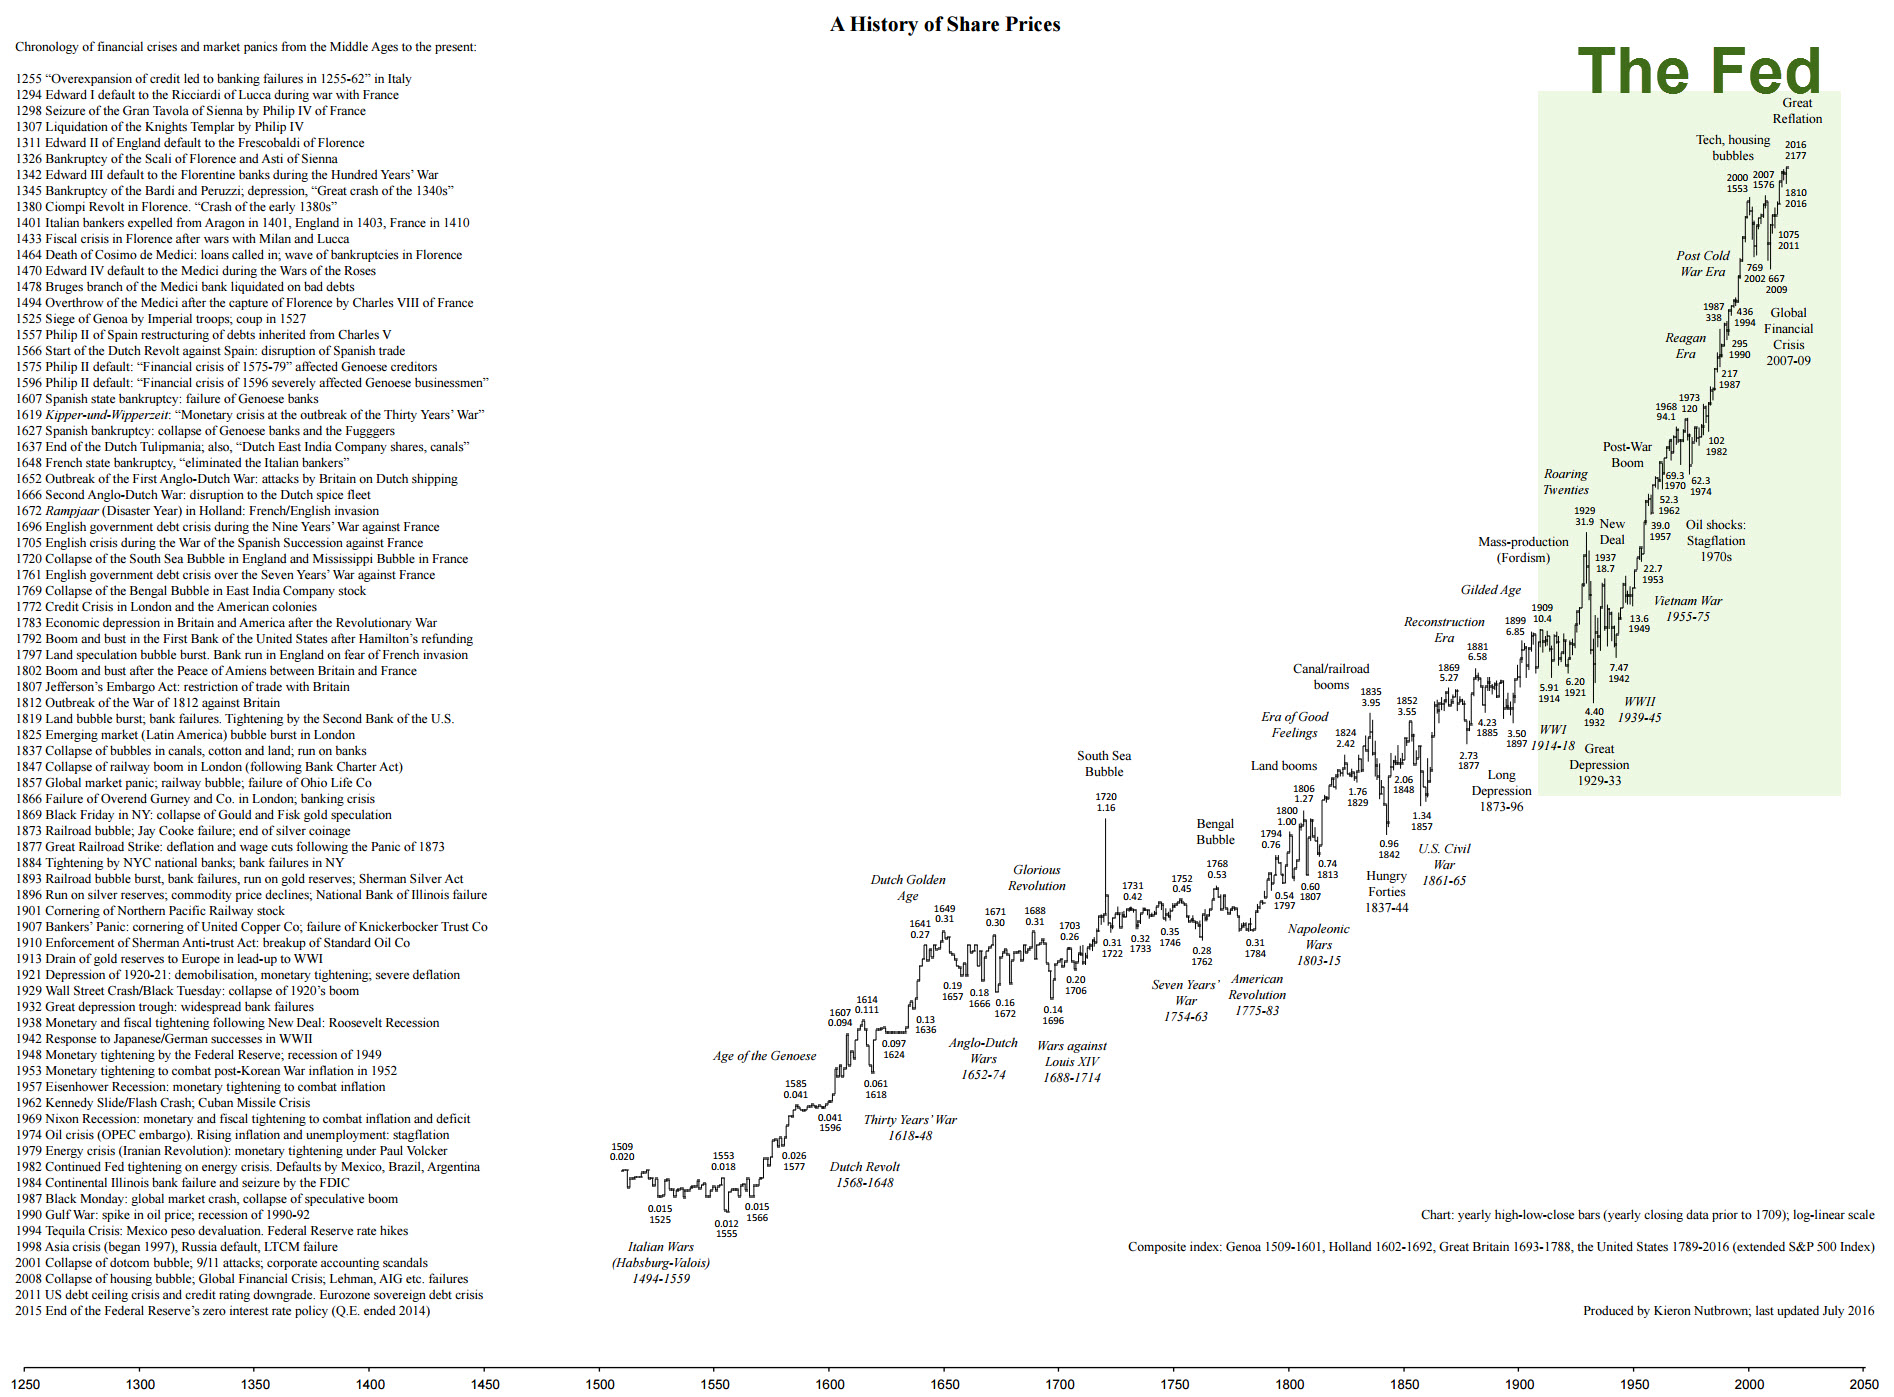
Very occasionally I see a chart that goes so very far back that I wonder what the sources are. This is the case with the chart attached here, produced by Kieron Nutbrown and last updated this year. Called, ‘Chronology of financial crises and market panics from the Middle Ages to the present’, annual bars are plotted on a log-linear scale. If nothing else the list of episodes, starting with Italy’s 1255 banking crisis, sound all too familiar. Wars, defaults, and bankers as pariahs are a never ending story.
Charts like this also focus the mind on the reliability of data and its vendors, the cleanliness of each time series, and its granularity. Before you roll up your sleeves and start doing ant technical analysis at all, ask yourself these questions: Can I trust this chart? Is it a true representation of facts? Are any bits missing? And always, am I missing something important here?
Tags: accuracy, Historical data, perspective
The views and opinions expressed on the STA’s blog do not necessarily represent those of the Society of Technical Analysts (the “STA”), or of any officer, director or member of the STA. The STA makes no representations as to the accuracy, completeness, or reliability of any information on the blog or found by following any link on blog, and none of the STA, STA Administrative Services or any current or past executive board members are liable for any errors, omissions, or delays in this information or any losses, injuries, or damages arising from its display or use. None of the information on the STA’s blog constitutes investment advice.


Latest Comments