Which Momentum Indicator Is Best? A Professional Technical Analyst's View
I recently asked traders which momentum indicator they use most often.
The responses were interesting. While there was no overwhelming winner, the poll confirmed something I've observed throughout my career: there is no single "perfect" momentum indicator. Each has strengths and weaknesses, and much depends on how you incorporate it into your overall analysis.
What 35 Years in the Markets Taught Me
During my years as a bank technical analyst, my research was used by fund managers, central banks, corporates, sales desks and traders. Working with such a diverse range of market participants gave me a unique perspective on how technical analysis is applied in the real world.
One lesson became very clear: no single momentum indicator consistently outperforms the others. The edge doesn't come from finding a "magic" indicator—it comes from understanding how different indicators complement one another and using them alongside trend analysis and price action.
After more than 35 years as a professional technical analyst, my own approach has evolved into using several momentum indicators together rather than relying on just one.
My Preferred Momentum Indicators
If I had to rank the indicators I use most frequently, it would probably look something like this:
- Relative Strength Index (RSI)
- Directional Movement Index (DMI)
- MACD
- Slow Stochastics
The RSI remains my favourite because it is simple, versatile and works well across multiple timeframes. It can help identify trend strength, momentum shifts and potential divergences before they become obvious on price charts.
That said, I rarely use RSI in isolation. I prefer to combine it with other momentum indicators that measure different aspects of market behaviour.
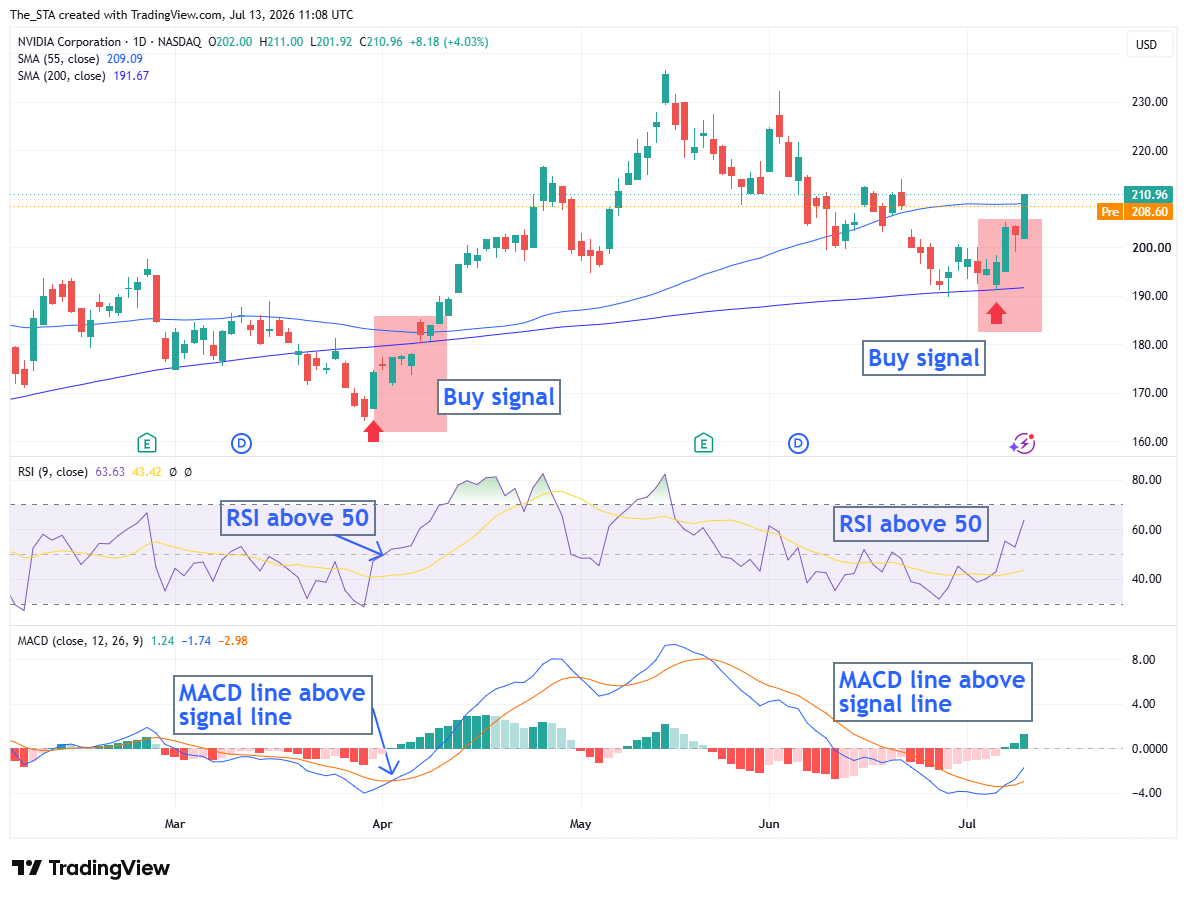
My Simple MACD and RSI Strategy
One of the cleanest momentum combinations is MACD together with RSI.
Rather than looking for overbought or oversold readings, I focus on confirmation between the two indicators.
Buy Setup
I look for:
- The MACD line crossing above the Signal Line, indicating bullish momentum is beginning.
- The RSI moving above the 50 level, confirming that buyers are taking control.
When both conditions occur together, it provides a much stronger signal than either indicator on its own.
Sell Setup
Conversely, I look for:
- The MACD line crossing below the Signal Line.
- The RSI falling below the 50 level.
Again, the combination provides confirmation that downside momentum is increasing.
This approach keeps the analysis simple and helps remove much of the subjectivity that can creep into trading decisions.
Why I Focus on the 50 Level on RSI
Many traders become fixated on the traditional 70 and 30 overbought and oversold levels.
Personally, I find the 50 level far more useful when analysing established trends.
I generally use a 9-period RSI and pay particular attention to whether it remains above or below the 50 line.
In a strong uptrend:
- RSI holding above 50 confirms the underlying bullish trend remains healthy.
- Pullbacks that remain above 50 are often simply corrections within the larger trend.
In a strong downtrend:
- RSI remaining below 50 confirms bears remain in control.
- Rallies that fail beneath 50 often present opportunities in the direction of the prevailing trend.
Rather than trying to call every market top and bottom, I prefer using RSI to determine whether momentum continues to support the primary trend.
Combining DMI with RSI
Another combination I use extensively is the Directional Movement Index (DMI) alongside RSI.
The DMI helps determine whether buyers or sellers are in control and whether a trend has sufficient strength to continue. When combined with RSI, it becomes a powerful way of filtering out weaker signals and focusing only on higher-probability opportunities.
I've previously recorded a video explaining exactly how I use this combination, which you can watch here.
I also explain in more detail why I focus on the RSI 50 level rather than simply looking for overbought or oversold conditions. Watch here.
No Indicator Should Be Used Alone
Perhaps the biggest lesson I've learned over the years is that no indicator should be used in isolation.
Momentum indicators are simply tools. They become much more powerful when combined with:
- Trend analysis
- Support and resistance
- Moving averages
- Price action
- Multiple timeframe analysis
When several pieces of evidence align, confidence in the trade increases significantly.
This is precisely why I believe debates about whether RSI is "better" than MACD, or whether DMI is superior to Stochastics, miss the point. Each indicator measures a different aspect of market behaviour. Used together, they provide a far more complete picture than any one indicator can on its own.
Final Thoughts
There isn't a universally "best" momentum indicator.
The best indicator is the one you understand thoroughly and apply consistently within a disciplined trading process.
For me, RSI remains my first choice, particularly when combined with MACD or DMI. Together they provide a straightforward, objective framework that helps identify whether momentum is supporting the prevailing trend.
I'd be interested to hear your thoughts.
Which momentum indicator do you rely on most, and why?
By Karen Jones FSTA Professional Technical Analyst and Content Creator for the STA
Karen Jones LinkedIn profile linkedin.com/in/karen-jones-fsta-a2907b9
#TechnicalAnalysis #MarketStructure #BehaviouralFinance