Cutting Through Market Chaos
When markets start to feel chaotic and everyone seems to be shouting over each other, I always find myself coming back to the charts. There’s something grounding about looking at a picture of price rather than getting swept up in the noise. And honestly, even if you’ve never studied technical analysis in your life, you can still see where the market has reacted before. That’s one of the reasons I think technical analysis has a real advantage during periods like this. We’re not trying to predict the future out of thin air — we’re looking back at how the market behaved in similar moments of uncertainty and using that information to frame what might come next.
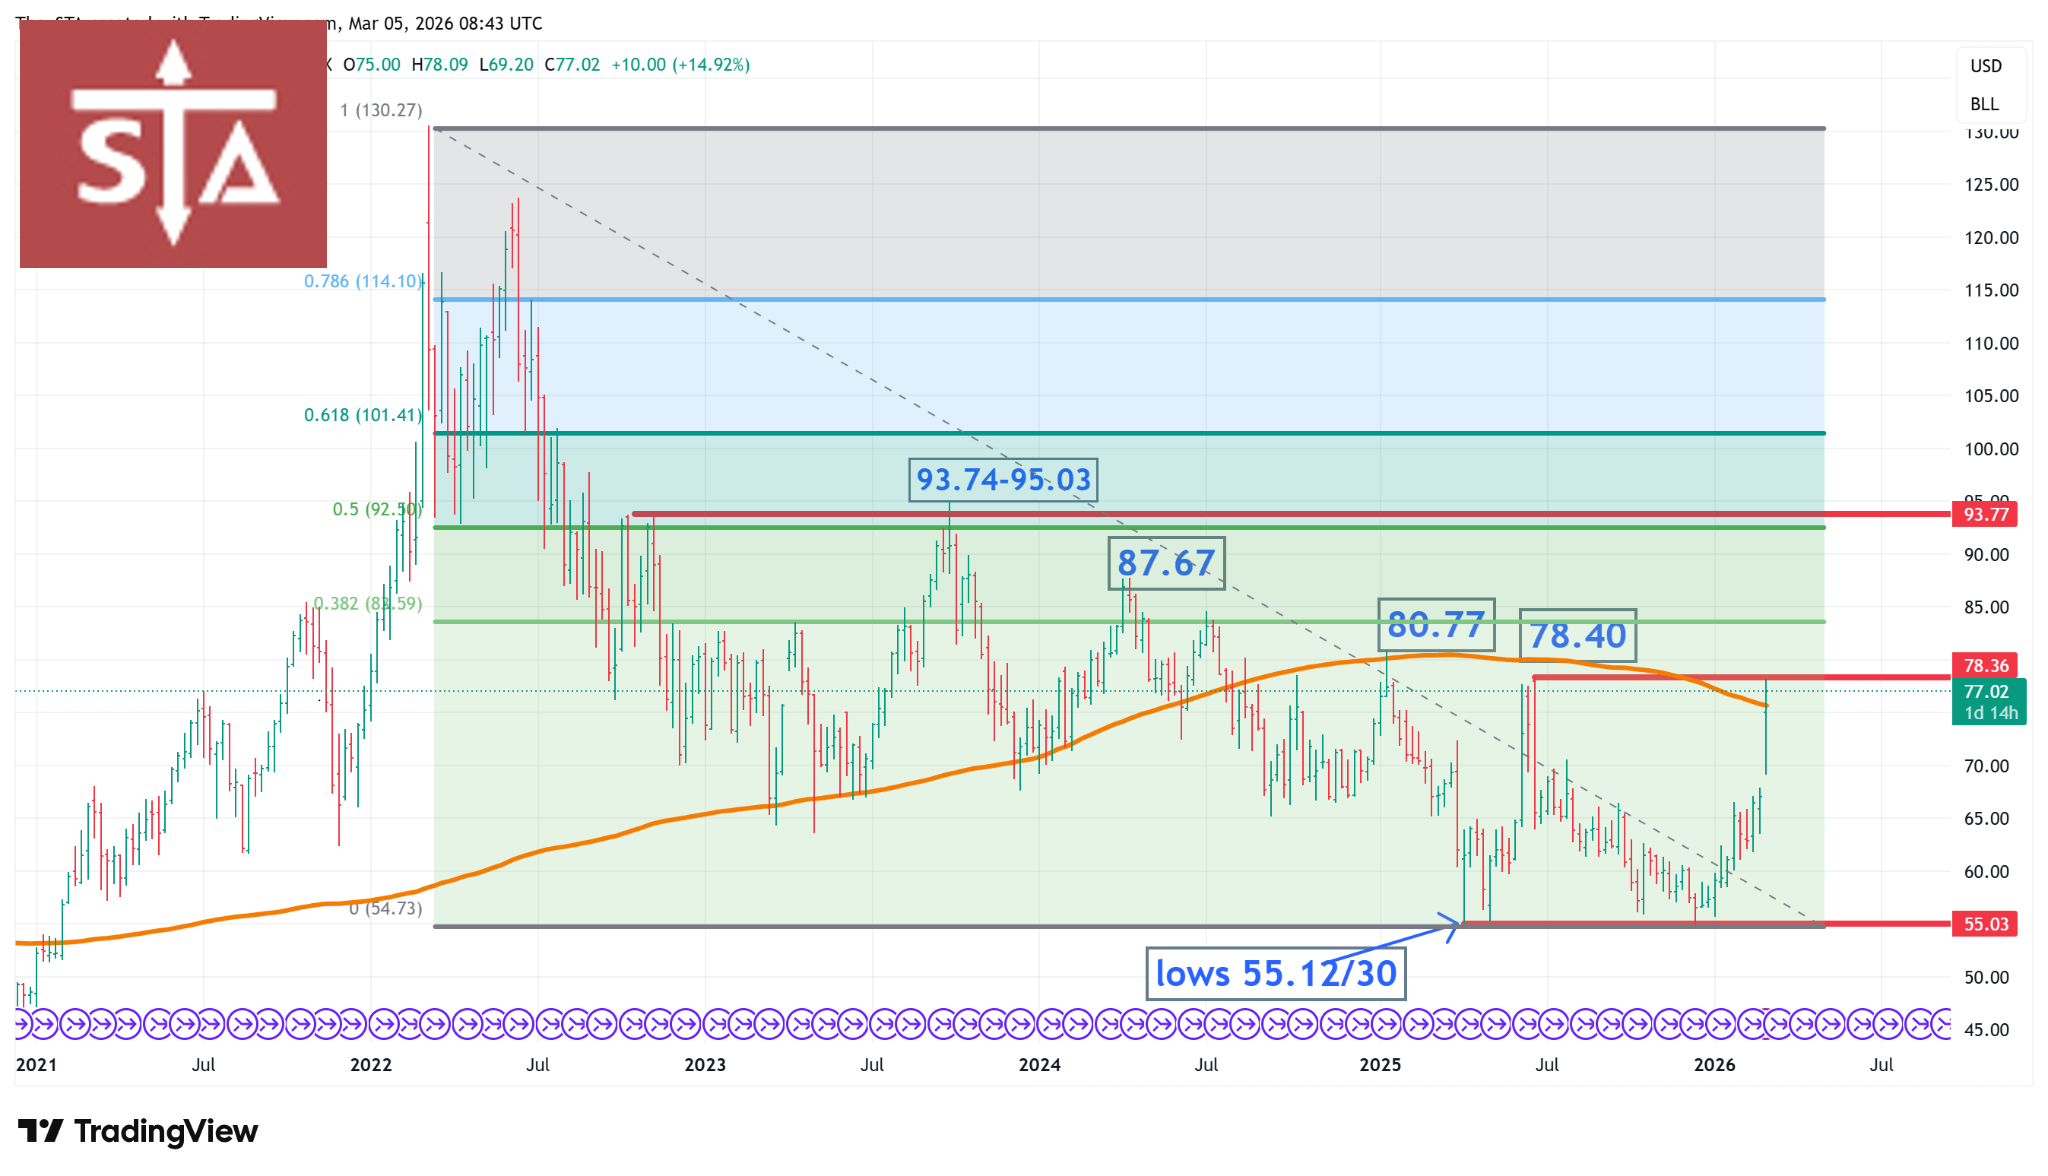
On the weekly crude oil chart, the market is pushing pretty hard into that June 2025 high around 78.40. You don’t need any specialist skill to see it. It’s a clear reaction point, and price is leaning right into it. If it does manage to break through that level, the next resistance zones are just as obvious: 80.77, then 87.67, and after that the much stronger band between 93.74 and 95.03. Even with only a basic understanding of charts, you can see how those areas stand out as places where the market has struggled before.
This is why I keep saying that in moments of heightened volatility or general uncertainty, stepping back and looking at the bigger picture can really help. Charts don’t tell you what will happen, but they do show you where the market has previously found trouble, hesitation, or momentum. And sometimes that’s all you need — a bit of structure when everything else feels messy.
Not investment advice.
#CrudeOil #TechnicalAnalysis #MarketLevels #PriceAction #ChartReading #WeeklyChart #MarketVolatility #TradingEducation #SupportAndResistance #MarketStructure